
Equity Curve Crossover Trading
A money management technique that often improves trading performance is to modify the number of shares/contracts traded based on crossovers of a moving average of the equity curve. Market System Analyzer (MSA) is a stand-alone Windows application that implements equity curve crossover trading. The basic idea is to trade either more or fewer shares/contracts when the equity curve crosses above or below its moving average. This can be an effective technique for increasing the size of winning trades while reducing the number of losing trades.
Market System Analyzer provides equity curve crossover rules through the Position Sizing command of the Analysis menu, which opens the dialog box shown below. The chosen rule is applied to the equity curve in the main chart window, which demonstrates how the rule would have affected the trading results.
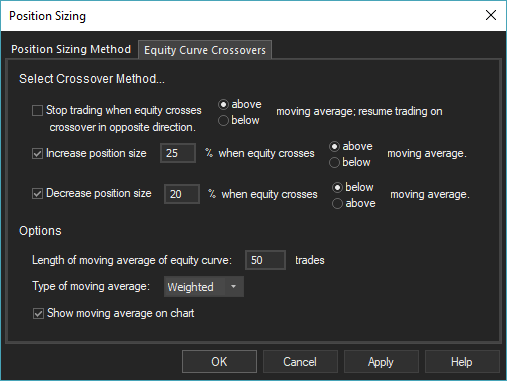
The equity curve crossover rules are presented on the Equity Curve Crossovers tab of the Position Sizing window.
There are three options for implementing equity curve crossovers. The first option, "Stop trading when equity crosses above/below moving average; resume trading on crossover in opposite direction" is the most basic method. If this option is selected, choosing either "above" or "below" indicates whether trading will stop when equity crosses above or below the moving average. If the system or method tends to produce streaks of wins and losses, "below" would normally be chosen. If the system or method tends to "revert to the mean," the most appropriate choice would be "above." (The dependency analysis feature of Market System Analyzer can be used to determine if the system or method is mean-reverting or tends to produce runs of wins and losses.) If the first option is chosen, the other two options are unavailable.
The second and third options reduce or increase the position size on moving average crossovers. Selecting the second option will increase the position size for the currently selected method by X% when the equity crosses above/below the moving average. Selecting the third option will decrease the position size by Y% when the equity crosses above/below the moving average. The second and third options can be selected together or one or the other can be selected alone. The increase or decrease in the position size is relative to the value as calculated without the rule and only applies to the next trade.
If both options are selected together, one option would typically use "above" and the other "below." For example, the second option might be to increase the position size 50% when equity crosses above the moving average. The third option might be to decrease the position size by 30% when equity crosses below the moving average. In this case, the position sizes are either 50% higher or 30% lower than they would be without this rule. Alternatively, the position size can be altered on crossovers in one direction but not the other by selecting only one of the second and third options. For example, if only the second option is selected with a percentage value of 40% and the direction "above," then the position size will be 40% higher on crossovers above the moving average and will return to the default values on crossovers below the moving average.
Under "Options", the length of the moving average of the equity curve can be entered. This is the number of trades used to calculate the moving average. Four different moving averages can be calculated: simple, exponential, weighted, and TRIX. Once the crossover rule is selected and the OK button is clicked, the equity curve in the main chart window will be updated to reflect the crossover rule. The performance statistics will be recalculated to match the new equity curve.
To learn more about Market System Analyzer (MSA), click here.
To learn how to perform a statistical significance test on your trading system or method using MSA, click here.