|
||
|
||
|
|
|
|
Is Your Account Size Large Enough for Your Strategy? by Michael R. Bryant
There are many factors that contribute to successful trading. While many retail traders would probably cite having a profitable strategy as the most important factor, professional traders often mention money management. In short, the pros know that proper money management is critical to long-term success. Perhaps the most fundamental aspect of money management for trading is being adequately capitalized.
Having adequate capital means being able to weather the inevitable ups and downs of trading. In considering whether you're adequately capitalized, you might ask "What's the likelihood I'll be profitable if I start with x dollars?". Another way to phrase the same question would be "What's the likelihood that my account equity will drop below x dollars?", where x might be, for example, the margin required to trade one futures contract or the dollar value of 100 shares of the stock you plan to trade. You know that if your account equity drops below this level, you'll have to stop trading.
While no one can predict the future, if you have good data, you can nonetheless come up with a good answer to this question. The keys are knowing what constitutes good data and using the right method to estimate the likelihoods involved. This article discusses this topic and presents a process for answering the question of whether your account size is large enough for your strategy.
Trade Data: Bad, Better, Best Since this article is about determining if we have enough capital to safely trade a given strategy, let's assume the strategy has not been traded yet and we therefore have no record of live trades. If we had live trading results, we would want to use those trades in our analysis since they would provide an unbiased estimate of future results. Otherwise, we have to rely on back-testing. Does this mean we can't obtain unbiased results for analysis? Not at all, but we need to be careful.
Most trading strategies are developed using some form of optimization, whether to generate the strategy logic itself (e.g., Adaptrade Builder) or to find suitable parameter values. When this is done, the selection of the final result introduces one or more biases. In particular, we need to be careful about both training bias and selection bias.1
Commonly, strategy developers and traders will optimize a strategy over one segment of data, typically referred to as the training or in-sample segment, then test it over a second set of data, often referred to as the test or out-of-sample segment. Because market data inevitably contains random elements (i.e., noise), the best results on the training segment are those that best fit both the signal and the noise present in the training data. This introduces training bias and is the source of the over-fitting that often plagues trading strategy developers.
In an attempt to avoid over-fitting, we might evaluate each parameter set on the test segment and select the one that performs best on that data, reasoning that the test data was not used in the optimization so that it will provide an unbiased result. However, selecting the result based on the performance on the test segment introduces selection bias. Basically, the test segment may favor one parameter set over another just due to luck. As a result, the chosen parameter set in this case is the one that has the best combination of true performance and luck. The part due to luck is the selection bias.
Despite the selection bias, it's better to select the parameter set based on the test segment than on the training segment. However, to obtain truly unbiased results requires a third segment, sometimes referred to as the validation segment. This is data not used in either training or as part of the test segment. Back-testing the strategy on the validation segment using the parameter set chosen from the test segment provides an unbiased estimate.* It's therefore the trade history from back-testing the strategy on the validation segment that we want to use for evaluating our account size.
A Monte Carlo Approach for Evaluating Account Size Once we have a valid set of trade results, we can use those trades to simulate trading starting with different possible starting account values. At this point, we have to assume that our trade history -- presumably obtained from back-testing our strategy on the validation segment -- is representative of the trades we'll experience in live trading. However, there are two aspects of the trade history that can affect our calculations that we should consider. Both of these relate to the maximum drawdown the simulated trading account will experience. Ultimately, it's the maximum drawdown that will determine whether the starting equity value is sufficient.
The first aspect of the trade history that can affect the drawdown is the ordering of the trades. History is unlikely to repeat, so if we use the historical sequence of trades to simulate trading, we'll fail to consider larger drawdowns that might result from a different ordering of the trades. Put another way, it's one thing to assume the trade history accurately represents the distribution of trades (in the statistical sense) from the strategy. It's quite another thing to assume any particular ordering of the trades. The first assumption is reasonable; the second one is not.
The second aspect of the trade history that can affect the drawdown is the number of trades. With a longer trade history, there is more opportunity to experience a larger drawdown. If the history is too short, there will be fewer opportunities for the large losing trades to build up into a large drawdown.
One way to account for both of these aspects is by using Monte Carlo analysis. Using Monte Carlo analysis, the trade distribution is randomly sampled to create a trade history, which is used to simulate an equity curve. The process is repeated many times and the results compiled to form a distribution for each calculated result, such as the maximum drawdown.
The basic approach, then, will be to use Monte Carlo analysis to simulate an equity curve starting with a specified account size. The simulation will take into account the minimum level of equity required to continue trading, such as the initial margin requirement for trading one futures contract. The Monte Carlo analysis will estimate the probability that the account will stay above the minimum required level. We can then try different starting account sizes to generate a curve depicting the relationship between starting account size and the likelihood of staying above the minimum level required to continue trading.
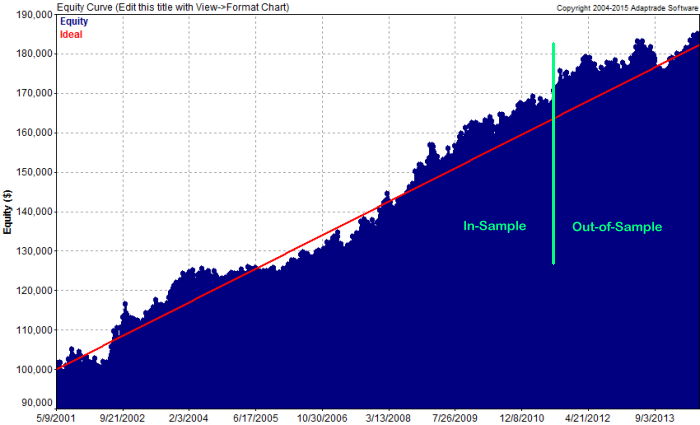
An Example To illustrate this approach, consider the equity curve shown below in Fig. 1. This curve comes from the MiniMax Clone strategy that I developed in 2011 using Adaptrade Builder. The MiniMax Clone strategy is designed to trade the E-mini S&P 500 futures. It comes from applying a reverse engineering approach to the MiniMax strategy and is included as a bonus strategy with Adaptrade Builder. The trades in the part of the curve to the left of the green line were part of the build process and are therefore labeled as in-sample. The trades to the right of the green line took place after the strategy was developed, so they don't benefit in any way from hindsight. Accordingly, that segment of the curve is labeled out-of-sample and is equivalent to the validation segment discussed above.
Figure 1. Equity curve from the MiniMax Clone strategy for trading the E-mini S&P 500 futures.
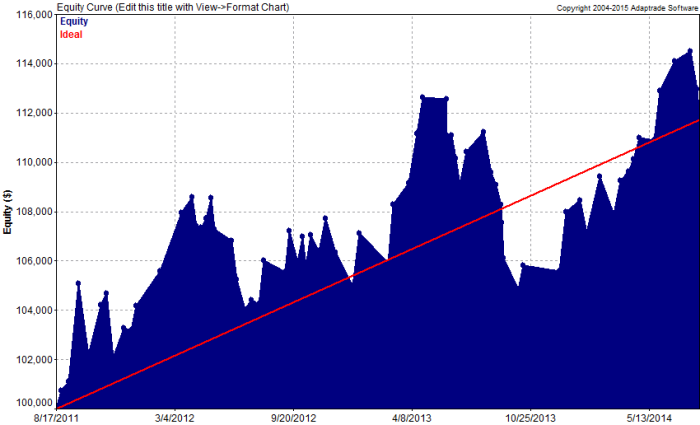
The out-of-sample segment of trades is shown by itself below in Fig. 2. The Monte Carlo (MC) analysis will be performed using Market System Analyzer (MSA). The basic Monte Carlo feature in MSA uses sampling without replacement. This means it samples each trade in the history exactly once, which is equivalent to forming each sequence of trades in the MC analysis by randomizing the original sequence. However, for the reasons discussed above, we would rather have a longer sequence of trades than the 70 trades shown in Fig. 2. Below, we'll see how much difference it makes whether the results are based on a sample size of 70 trades or a much longer sampling of trades.
Figure 2. Out-of-sample portion of the equity curve for the MiniMax Clone strategy.
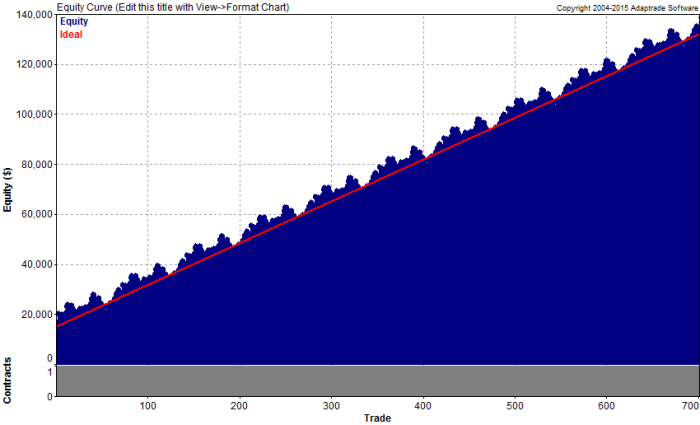
To obtain a longer sampling of trades, the trades in the original sequence can be duplicated. The easiest way to do this in MSA is to repeatedly import the original file of trade data consisting of the 70 out-of-sample trades. When importing a file of trade data into MSA, the program will ask if you want to replace the existing trades or append the imported trades to the existing ones. In this case, we can append the trades to the existing (same) trades. If we perform this import operation a total of 10 times, we'll have a total of 700 trades, as shown below in Fig. 3.
Figure 3. Out-of-sample trades from the MiniMax Clone strategy repeated 10 times.
The only trick to making this work is make sure the entry and exit dates are not read in from the file of trade data. If the trades have entry and exit dates and the dates were read in each time the list of 70 trades was imported, the trades would overlap 10 times, rather than repeating one group after the other. To have MSA ignore the date fields, the labels for the entry and exit dates should be set to "No label/skip" on the Trades File Format window. Entry and exit dates don't enter into the MC analysis, so they can be skipped without affecting the results. Also keep in mind that the fact that the trades are neatly ordered into 10 repeating groups has no bearing on the MC results because the MC analysis randomizes the order of the trades.
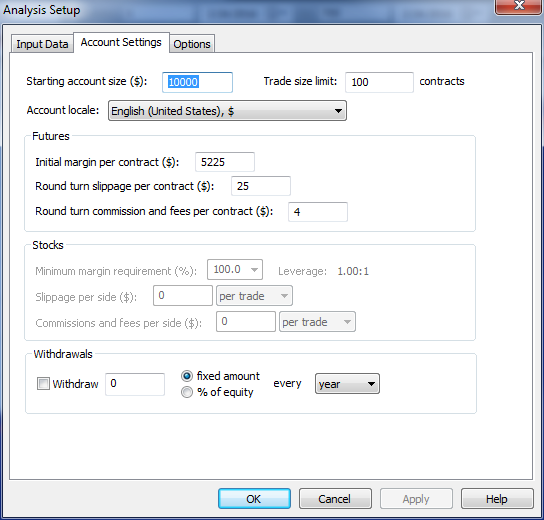
Before the MC analysis is run, the settings shown below in Fig. 4 and Fig. 5 should be made. Fig. 4 shows where the starting account size is entered. The initial margin requirement ($5,225) is also entered on this window, as is the round turn trading costs (commissions, fees, and slippage).
Figure 4. Account settings are entered on this window in Market System Analyzer (MSA).
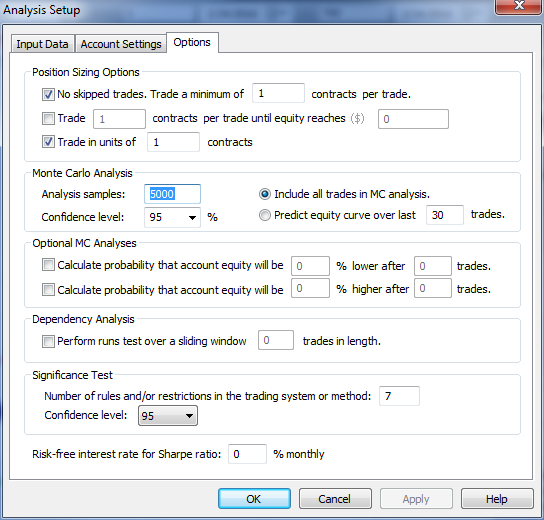
In Fig. 5, below, the number of analysis samples for the Monte Carlo analysis has been set to 5000. This is the number of times the equity curve is simulated, where each simulation involves a different random ordering of the 700 trades. The confidence level is set to 95% in the figure. This is the confidence level for which the performance report is generated. As will be shown below, select results are also reported at a range of confidence levels.
Figure 5. The options for the Monte Carlo analysis are entered on this window in Market System Analyzer (MSA).
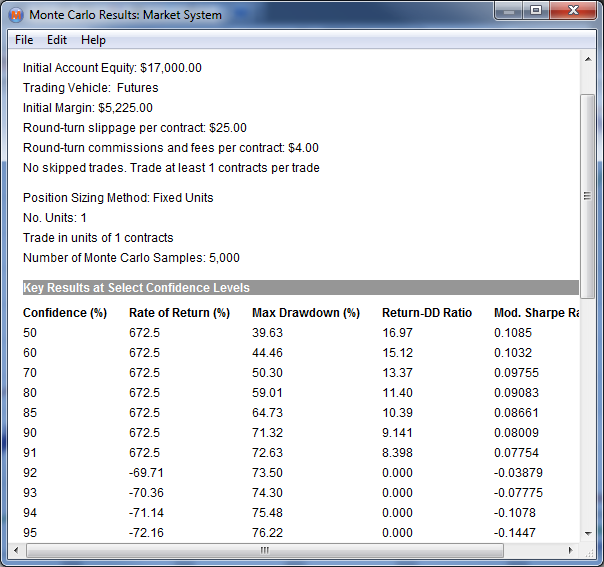
Once the settings have been made, the Monte Carlo analysis can be run by selecting "Monte Carlo Analysis" from the Analysis menu or by pressing the F4 key. The process will be to enter different account sizes, as in Fig. 4, and record the confidence level at which the trading is no longer profitable. More precisely, we'll record the highest listed confidence level for which the net return is positive. For example, consider the Monte Carlo results shown below in Fig. 6 for a starting account size of $17,000.
Figure 6. Monte Carlo simulation results for the MiniMax Clone strategy starting with $17,000 and trading one contract per trade.
From the table of "Key Results ...", it can be seen that the highest confidence level with a positive return is 91%. This implies that if we start trading with $17,000, the likelihood of being profitable in the long-term is about 91%. Notice from this figure that at lower confidence levels, the gap between listed confidence levels is either 5 or 10 percentage points. To obtain more accurate confidence level estimates at lower confidence levels, a quick trial-and-error process can be followed to interpolate between the listed levels. To do this, the confidence level setting shown in Fig. 5 is set to an intermediate level and the rate of return in the lower part of the report (not shown) is examined to see if it's positive. It usually only takes a few attempts to find the confidence level to within one percentage point. In most cases, this is not necessary since only the higher confidence levels are of interest.
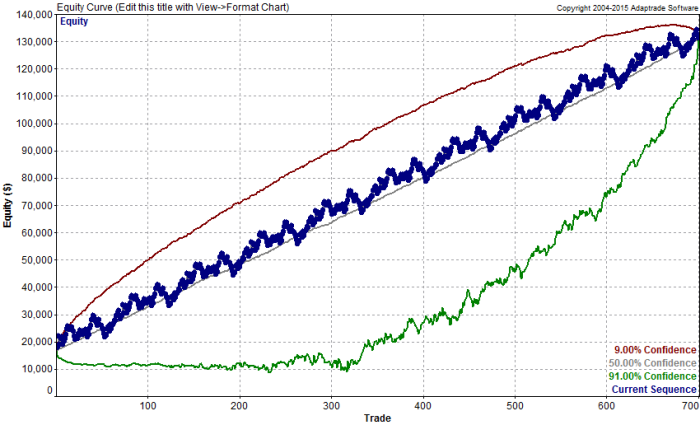
MSA also presents the Monte Carlo results visually as confidence bands on the equity curve plot, as shown below in Fig. 7. This figure shows the confidence bands when the confidence level is set to 91% on the Analysis Options window, as shown in Fig. 5, and the starting equity is $17,000. The green band is the equity curve at 91% confidence. As shown in the figure, it stays positive despite some apparently large drawdowns.
Figure 7. Monte Carlo confidence bands at 91% confidence for the MiniMax Clone strategy starting with $17,000.
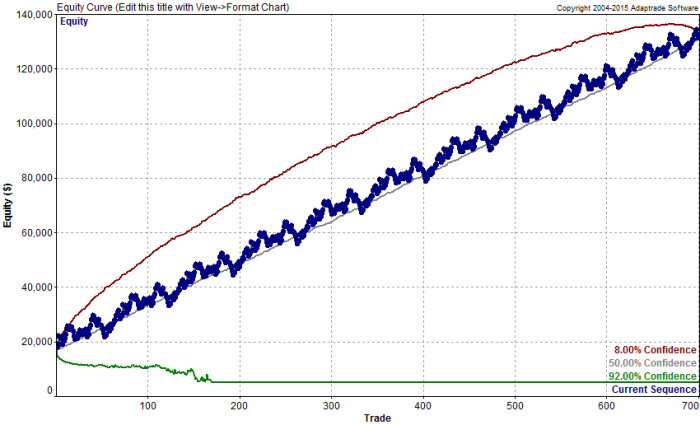
Compare Fig. 7 with Fig. 8, below, which shows the same results but at 92% confidence. Notice that the green line in Fig. 8 drops down to a level below the starting account equity (i.e., a net loss) and stays there, implying that the simulated trading was stopped because the equity level dropped below the level at which it's possible to trade a single contract (i.e., the initial margin requirement). This provides an alternative, visual method to identify the confidence level associated with a specified starting account value.
Figure 8. Monte Carlo confidence bands at 92% confidence for the MiniMax Clone strategy starting with $17,000.
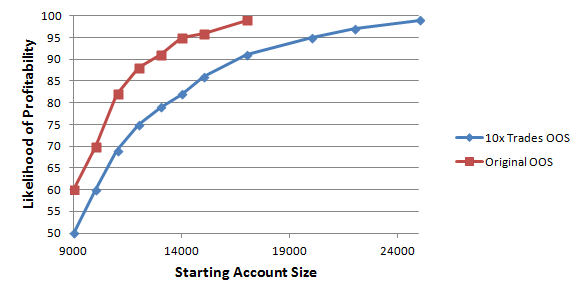
If we repeat this analysis for other starting account sizes -- using either the tabular listing in the MC report or the visual method above, we can generate the plot shown below in Fig. 9. As expected, as the starting account size increases, the likelihood of being profitable approaches 100% (blue line). For comparison, the same analysis was performed with the original sample of 70 out-of-sample trades (red line). At each value of starting account equity, the red line is above the blue line, which implies that basing the analysis on the smaller sample of trades over-estimates the likelihood of trading profitably.
Figure 9. The relationship between starting account size and likelihood of profitable trading based on a Monte Carlo simulation of the MiniMax Clone strategy.
One last issue to consider is that the results shown above only looked at whether it was possible to continue trading or not. The likelihoods shown in Fig. 9 are effectively the probabilities that the account won't blow out. However, not blowing out doesn't mean the drawdowns might not be very large. For example, the confidence level of 91% shown in Fig. 6 corresponds to a worst-case drawdown of 71%.
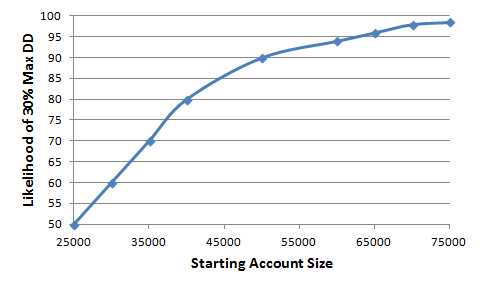
An alternative analysis would be to use the Monte Carlo results to ask what the confidence level is for achieving a worst-case drawdown less than a specified value for a given starting account size. For example, let's assume we want to know what account size we would need to keep the maximum drawdown to 30% or less. We could repeat the analysis as above except that instead of using the "Rate of Return" column in Fig. 6, we would use the "Max Drawdown" column, selecting the highest confidence level such that the maximum drawdown was no more than 30%. Fig. 10, below, displays the results of this analysis.
Figure 10. The relationship between starting account size and likelihood of achieving a maximum drawdown no worse than 30% based on a Monte Carlo simulation of the MiniMax Clone strategy.
As we would expect, much higher starting account sizes are required at each confidence level to avoid exceeding a drawdown of 30% compared with the confidence levels shown in Fig. 9. Selecting the starting account size for trading based on this analysis would clearly be much more conservative than using the results from Fig. 9.
Discussion Determining the capital required for trading is one of the most fundamental aspects of money management. Even the best trading strategies require a minimum level of equity to raise the likelihood of profitable trading above an acceptable threshold. Without sufficient capital, the account equity could drop so low that it's no longer possible to afford another contract or the minimum number of shares.
This article discussed two basic considerations in estimating the required account level to give you enough confidence that your trading will be profitable. First, the requirement for valid trade data was discussed. An unbiased estimate of future results is the foundation on which the analysis rests. Secondly, a Monte Carlo approach was presented as a way to account for the fact that the ordering of trades in the future from a presumed distribution of trades is unknown. The Monte Carlo approach allows us to consider the worst-case (or nearly) ordering of trades from the trade distribution.
There are a few caveats, however. First, the markets tend to be non-stationary, which means their statistical properties change over time. This is why trading strategies that have been profitable in the past tend to fade over time.** Because of this fact, any analysis based on past data -- whether true validation results or even results from real-time trading -- should be viewed as having a limited lifespan. The account size estimate generated using the method presented here will be valid only as long as the distribution of trades that it was based on remains valid. If the market characteristics on which the strategy was based start to change, the statistical properties of the strategy will change, and a larger (or hopefully smaller) account size may be required.
As an example of this point, the reader may have noticed that the out-of-sample history for the MiniMax Clone strategy shown above (e.g., Fig. 2) does not extend into the present. That's because the performance started to drop off in 2015. While the out-of-sample performance remained positive for three years after the strategy was built, non-stationarity caught up with it last year. I chose not to include 2015 because, in practice, the strategy would have either been rebuilt, re-optimized or replaced. It wouldn't make any sense to plan to trade a strategy that was not performing well.
Also note that the analysis presented above assumed one contract per trade. Whether this makes sense for you depends on how you trade. If you tend to keep your position size the same over time, it makes sense. However, if you tend to increase your position size with increases in account equity, that should be included in the simulation since it will affect the drawdown. MSA makes it easy to account for this by allowing you to change the position sizing settings and choose from among 12 different position sizing methods.
An approach such as the one described here can be used whenever you're planning to start trading a new strategy. If the strategy is being added to an existing portfolio of market systems, the planned portfolio can be analyzed and a portfolio-level Monte Carlo analysis can be performed to generate the same basic result. Whether or not you choose to base the analysis on the likelihood of remaining profitable or the likelihood of staying below a specified drawdown level depends on your personal risk tolerance.
References
Good luck with your trading.
Mike Bryant Adaptrade Software
* This assumes no "cheating" occurs. For validation testing results to be unbiased, only the single parameter set selected from the test segment can be evaluated on the validation segment. If multiple sets are tested on the validation segment, the segment effectively becomes part of the test segment, and the resulting selection will be subject to selection bias.
** Some might argue that strategies tend to fade over time
because the strategy's edge gets "traded away." However, both points of view
amount to the same thing. If a strategy loses its edge due to over-trading, it's
because the statistical properties of the market on which the strategy is based
have changed. _____________________
This article appeared in the February 2016 issue of the Adaptrade Software newsletter.
HYPOTHETICAL OR SIMULATED PERFORMANCE RESULTS HAVE CERTAIN INHERENT LIMITATIONS. UNLIKE AN ACTUAL PERFORMANCE RECORD, SIMULATED RESULTS DO NOT REPRESENT ACTUAL TRADING. ALSO, SINCE THE TRADES HAVE NOT ACTUALLY BEEN EXECUTED, THE RESULTS MAY HAVE UNDER- OR OVER-COMPENSATED FOR THE IMPACT, IF ANY, OF CERTAIN MARKET FACTORS, SUCH AS LACK OF LIQUIDITY. SIMULATED TRADING PROGRAMS IN GENERAL ARE ALSO SUBJECT TO THE FACT THAT THEY ARE DESIGNED WITH THE BENEFIT OF HINDSIGHT. NO REPRESENTATION IS BEING MADE THAT ANY ACCOUNT WILL OR IS LIKELY TO ACHIEVE PROFITS OR LOSSES SIMILAR TO THOSE SHOWN. |
If you'd like to be informed of new developments, news, and special offers from Adaptrade Software, please join our email list. Thank you.
For Email Marketing you can trust
|
|||||||||||||
|
|
|
|
|||||||||||||
Copyright (c) 2004-2019 Adaptrade Software. All rights reserved.