
Adaptrade Software Newsletter Article
Doubling Buy-and-Hold Returns with Micro E-minis
Active trading, such as day trading on intraday data, is a popular approach with many traders and has been the focus of many of my newsletter articles. Nonetheless, there are reasons to consider longer-term strategies as well. For some traders, the extra time and effort required to manage an active trading strategy may not be worth the potential reward, especially considering the additional risk that often accompanies active trading. Also, even if your focus is short-term trading, it might be worthwhile to add a longer-term strategy to your trading portfolio for diversification.
If you've ever considered developing a longer-term strategy, you might have wondered if it would be possible to come up with a strategy that trades infrequently, similar to a buy-and-hold investment, but with the higher returns of a trading strategy. For example, an obvious approach would be to buy a stock index ETF with two-times leverage. Doubling the leverage should (approximately) double the return of the index. Unfortunately, virtually all broad stock indexes have dropped more than 50% at some time in the past 20 years. With 2x leverage, a 50% drop in the index means a 100% loss. What's needed is a way to avoid the big market declines while being in the market for most of the rallies. In other words, we need a little bit of trading logic. If possible, this would give us the ideal compromise between the simplicity of investing and the higher returns of trading.
This article will demonstrate how to achieve these goals using the new Micro E-mini index futures from the Chicago Mercantile Exchange (CME). I'll start with an overview of the Micro E-minis and show how to use the strategy generating tool Adaptrade Builder to build some relatively simple strategies that generate double the return of the underlying index while maintaining drawdowns at manageable levels. The code for the top strategy is available below.
The Micro E-mini Index Futures
In May of this year, the CME started trading new stock index futures contracts called the Micro E-minis, which are one-tenth the size of the regular E-minis. The smaller size makes it possible to use small amounts of leverage with a fairly small account. For example, with the S&P 500 at a price of 3000, the value of the futures contract is $15000, so an account size of $7500 could buy one contract at 2x leverage. To obtain leverage of no more than 2x with one contract of the regular E-mini at the same price would require an account size of $75000. The available Micro E-mini stock index futures are listed below in Table 1.
| Symbol | Description | Point Value | Margin |
|---|---|---|---|
| MES | Micro E-mini S&P 500 Index Futures | $5.00 | $630 |
| MNQ | Micro E-mini Nasdaq-100 Index Futures | $2.00 | $760 |
| M2K | Micro E-mini Russell 2000 Index Futures | $5.00 | $355 |
| MYM | Micro E-mini Dow Jones Industrial Average Index Futures | $0.50 | $550 |
- The point value is defined such that the value of the contract is equal to the index value times the point value.
- Margin is the maintenance margin as of July 17, 2019.
- The minimum move for each instrument is the same (in points) as for the corresponding regular E-mini.
- The hours for each instrument are Sunday to Friday, 6:00 pm to 5:00 pm Eastern Time (ET), with a trading halt from 4:15 pm to 4:30 pm.
Building Long-Term Strategies for the Micro E-minis
As discussed above, the goal is to build strategies for stock index futures that roughly double the return of the underlying stock index without also doubling the worst-case drawdown. Doing that will most likely require trading in and out of the market at least a few times per year. Also, if there are few trades, each one will be held a long time, which means the intra-trade drawdowns (also known as the maximum adverse excursion or MAE) could be large. This is the trade-off we should expect for the simplicity of a strategy that trades infrequently.
So how can we develop strategies that fit this basic profile? The traditional approach would be to examine the price charts and come up with an idea for the entry logic that looks like it would avoid large price drops while staying in the market during up trends. The idea would then be translated into a suitable programming language, and exit conditions and other features would be added to complete the strategy. It would then be tested, optimized, and retested as necessary. Typically, the initial idea wouldn't work as expected, so some changes would be necessary, and the process would be repeated. After some weeks or months of trial-and-error, something suitable might be found.
Instead of following that approach, I'll use the strategy generating tool Adaptrade Builder, which I developed specifically to avoid the tedious, often ineffective trial-and-error process of strategy building that many traders still follow. With Builder, the steps are much simpler: (1) add the price data for the target symbols, (2) specify the performance requirements, (3) select preferences for indicators, order types, and other basic logic (e.g., whether the strategies should be long-only, short-only, or long/short), and, finally, (4) click the Build button. The program is designed to automate the difficult parts of strategy building, including developing the trading logic, coding the strategies, testing them out-of-sample, and repeating the process as necessary until it meets the requirements you've set.
The key settings used in Adaptrade Builder to build the strategies are shown below.
Micro E-mini S&P 500 futures, continuous contract (IQFeed symbol @MES#)
Daily bars, Globex session (as given above)
Date range: 1/7/2000 to 7/18/2019
$10 per round-turn trading costs
Market Sides: Long trades only
A limited set of indicators (see the project file below)
No order types with dollar-based parameters
Position sizing: 200% of Equity (i.e., 2x leverage)
Build Objectives and Conditions:
Maximize Net Profit, weight 1.000
Maximize Corr Coeff, weight 1.000
Maximize Trade Sig, weight 1.000
Ave Annual Return ≥ 10.000%
Trades Per Year ≤ 10.00
Corr Coeff ≥ 0.9500
Trade Sig ≥ 95.0000%
Conditions for Selecting Top Strategies:
Max Drawdown (%) ≤ 40.000%
Ave Annual Return ≥ 12.000%
PL/Buy&Hold Ratio ≥ 2.000
Trades Per Year ≤ 10.00
Build Options:
Population Size: 500
No subpopulations
Reset population when building
Save 100 best strategies from population
Crossover Percentage: 60.00%
Mutation Percentage: 50.00%
Tree Depth: 3
Tournament Size: 2
At end of generation 75, start over if average net profit on test segment is less than $10,000,000
Because the Micro E-minis have only been trading since May 2019, I used price data for the regular E-mini S&P 500 (symbol ES) with the point value set to $5.00 to represent the MES. Since both symbols trade on the CME through the Globex system during the same hours and with the same tick size, there should only be small differences in price between the two symbols.
Normally, the data would be divided into training, test, and validation segments, which the program automatically tracks and uses to monitor the build process and provide out-of-sample testing. However, because of the requirement to have only a few trades per year, the strategies were built over the full range of data in order to generate an adequate number of trades. To provide out-of-sample testing, the strategies were then evaluated on other Micro E-mini symbols, as explained below.
Although it's just as easy to enter short trades with futures as it is to trade the long side, I decided to restrict the strategies to long trades to keep the strategies as simple as possible, consistent with the small number of trades I was expecting. That way, the build process would be focused primarily on the single task of avoiding down markets, rather than on the dual requirements of taking advantage of both rallies and declines.
Among the other settings listed above, order types with dollar-based parameters were removed so that the resulting strategies would not be closely tied to the symbol. This was deemed necessary to allow the strategies to be tested out-of-sample on other symbols. For example, a stop entry order that sets the price at $500 above the prior day's close was not allowed. Instead, entry and exit orders were restricted to those based on percentage values or calculated prices.
To ensure the leverage was 2x (two times or two-to-one), "percent of equity" position sizing was selected with a value of 200%. This means the size of each position — the number of contracts — was set so that the position would have a value equal to twice (200%) of the account equity. Accounting for rounding effects, the resulting leverage of each trade was therefore just under 2x.
The build objectives and conditions guide the build process. Most of the metrics used in the objectives and conditions shown above are standard ones that can be used with any strategy, such as net profit, correlation coefficient, and trade significance. I've discussed these in prior articles (see, for example, this article). The two metrics specific to this project are "Ave Annual Return" and "Trades Per Year". The former helps guide the process towards strategies that have at least 10 percent annual rate of return, which was chosen because it represents slightly more than the long-term average of the S&P 500 index. The latter helps to generate strategies that have no more than 10 trades per year, consistent with the goal of developing strategies that trade infrequently.
In addition to the strategies that the program evolves as it executes the build algorithm, Builder maintains a separate set of strategies called the Top Strategies population. These strategies are identified by a set of requirements called the Conditions for Selecting Top Strategies, as shown above. Any strategy that meets these conditions at any point in the build process is copied to the Top Strategies population. The key metrics used in setting these conditions for this project include the ones discussed above and two others: "Max Drawdown (%)" and "PL/Buy&Hold Ratio". As discussed above, the maximum historical drawdown for stock indexes is more than 50%, so with 2x leverage, it's necessary to screen for high drawdowns. The PL/Buy&Hold Ratio is how the process screens for strategies that beat buy-and-hold. This metric calculates the ratio of the profit/loss per contract to the buy-and-hold profit/loss per contract. Requiring this metric to be greater than 2 is a way to identify strategies that double the buy-and-hold return of the index.
The last group of settings above lists the Build Options. Most of these have been set to default values. The last one, however, consists of a so-called "Build Failure Rule", which is used here to reset the build process after every 75 generations. Since there is no test segment, the condition specified in the rule can never be met (i.e., the net profit on the test segment will never exceed $10,000,000), so the build process will start over at the end of generation 75. The Top Strategies conditions are used to continually screen for strategies from all builds. After some period of time, if the Top Strategies population has a sufficient number of strategies, the build process can be cancelled manually.
All settings described above are available in this project file, which can be opened in Adaptrade Builder version 2.4.1. The program is available as a free trial via the Builder download page for those who want to examine the project file but don't have a licensed copy of the program. To see a list of all settings without opening the Builder project file, a text version of the build report is available here . If you want to jump ahead, the EasyLanguage code for TradeStation/MultiCharts for the final strategy is available here.
Testing and Validating on Other Symbols
As noted above, the usual process of building on a training segment, tracking the results on a test segment, and validating the strategies on a validation segment was not followed for this project due to the limited number of trades expected. Instead, additional Micro E-mini symbols were used to test and validate the strategies. In particular, the strategies were built on the Micro E-mini S&P 500 futures (MES) until several dozen strategies were found that met the criteria of the Top Strategies population. Although the build process could have been allowed to run longer, I stopped it after 36 rebuilds (75 generations each), which took approximately seven hours. This was the training step.
The next step was to screen the top strategies further against the Micro E-mini Nasdaq-100 (MNQ). In this step, each strategy in the Top Strategies population was evaluated on the MNQ, and the best strategy was chosen. While this step was ultimately subjective, I looked at two main criteria: (1) a smooth-looking equity curve on both the MES and MNQ, and (2) values of the key metrics, such as PL/Buy&Hold Ratio, max drawdown, and average annual return that held up well on the MNQ. This step was similar to using a test segment.
Because selecting the strategy among several dozen based on its performance on the MNQ introduced selection bias (see this article for an explanation of selection bias), the selected strategy was evaluated out-of-sample on data from the Micro E-mini Dow Jones index (MYM) and the Micro E-mini Russell 2000 index (M2K). This was the validation step. No further use of the data was made for these strategies, which insured that the results on the MYM and M2K were truly out-of-sample.
Results
The equity curve for the strategy developed using the process described above is shown below in Fig. 1 over the Micro E-mini S&P 500 futures (MES).
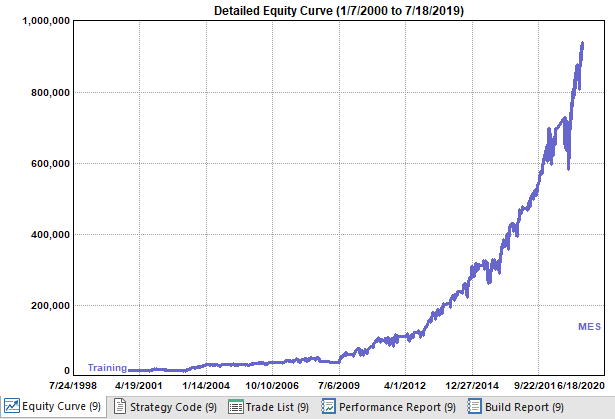
Figure 1. Equity curve for final strategy evaluated on the Micro E-mini S&P 500 (MES).
Key performance statistics for the results shown in Fig. 1 are given below.
Starting Equity: $20,000.00
Net Profit: $900,030.00
Ave Annual Return: 21.63%
Max Drawdown (%): 32.94%
PL/Buy&Hold Ratio: 2.12
Trades Per Year: 2.03
Ave Leverage: 1.96
Pct Wins: 78.95%
Prof Fact: 5.26
Since these results are from the training data, they necessarily meet all the Top Strategies conditions shown previously. The equity curve generated by evaluating the strategy on the Micro E-mini Nasdaq-100 (MNQ) is shown below in Fig. 2.
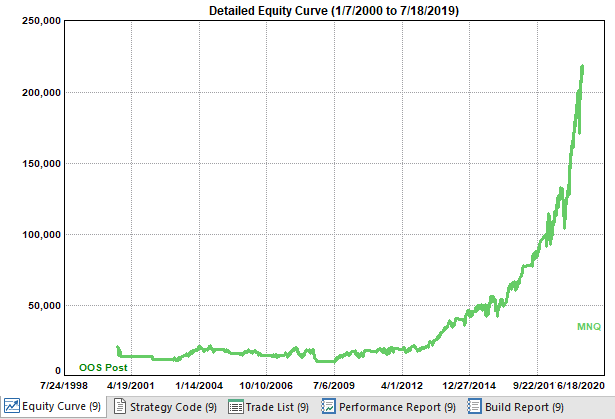
Figure 2. Equity curve for final strategy evaluated on the Micro E-mini Nasdaq-100 (MNQ).
Key performance statistics for the results shown in Fig. 2 are given below.
Starting Equity: $20,000.00
Net Profit: $192,380.50
Ave Annual Return: 12.33%
Max Drawdown (%): 54.61%
PL/Buy&Hold Ratio: 1.75
Trades Per Year: 2.29
Ave Leverage: 1.89
Pct Wins: 62.79%
Prof Fact: 4.37
Because the strategy was not built using data for the MNQ, it's not surprising that the results on this market are not quite as good as on the MES. Nonetheless, the net profit-to-buy-and-hold ratio is 1.75, which is close to the goal of 2.0 set for the MES. While the drawdown exceeds the build goal of 40%, it's still manageable considering the leverage is nearly 2x and it requires taking an average of only 2.29 trades per year.
The results on the MNQ are still subject to selection bias. The out-of-sample results on the MYM and M2K are intended to provide validation that the selected strategy was not over-fit to either the MES or MNQ. The equity curve generated by evaluating the strategy on the Micro E-mini Dow Jones Industrial Average (MYM) is shown below in Fig. 3.
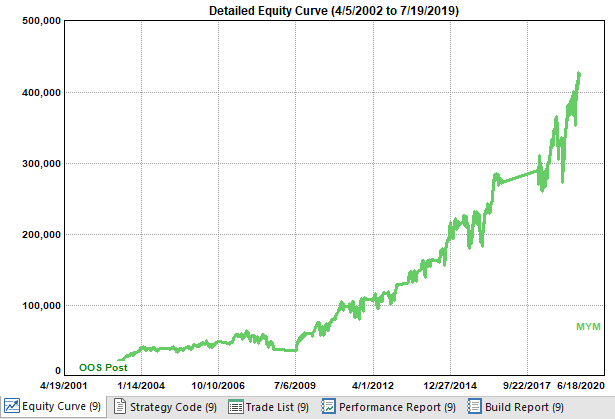
Figure 3. Equity curve for final strategy evaluated on the Micro E-mini Dow Jones Industrial Average (MYM).
Key performance statistics for the results shown in Fig. 3 are given below.
Starting Equity: $20,000.00
Net Profit: $401,717.00
Ave Annual Return: 19.07%
Max Drawdown (%): 44.57%
PL/Buy&Hold Ratio: 1.05
Trades Per Year: 2.12
Ave Leverage: 1.96
Pct Wins: 80.00%
Prof Fact: 3.22
The net profit, average annual return, maximum drawdown, and percentage winners are all better on this out-of-sample test than on the MNQ. The profit/loss per contract still exceeds the buy-and-hold profit/loss per contract, although not by much.
The final out-of-sample test was on the Micro E-mini Russell 2000 (M2K). The equity curve from this test is shown below in Fig. 4.
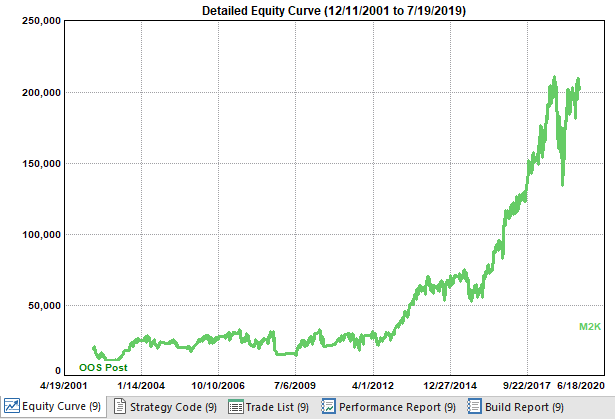
Figure 4. Equity curve for final strategy evaluated on the Micro E-mini Russell 2000 (M2K).
Key performance statistics for the results shown in Fig. 4 are given below.
Starting Equity: $20,000.00
Net Profit: $181,632.00
Ave Annual Return: 14.16%
Max Drawdown (%): 56.31%
PL/Buy&Hold Ratio: 1.38
Trades Per Year: 2.78
Ave Leverage: 1.95
Pct Wins: 55.32%
Prof Fact: 2.18
Visually, the equity curve for this market is not as uniform as the others. However, overall, the results shown above demonstrate that the strategy held up well on this market. For example, the profit/loss per contract exceeds the buy-and-hold profit/loss per contract by 38%.
Discussion
Developing a trading strategy that has characteristics of both buy-and-hold investing and active trading requires a compromise between the attributes of both approaches. The principal attributes of investing are simplicity and matching the returns of the underlying instrument. This led to the goal of doubling the return of the underlying instrument using 2x leverage. Achieving this without also doubling the worst-case drawdown of the index required attributes of trading. In particular, it was necessary to use enough trading logic to avoid holding trades through large drawdowns while minimizing the number of trades.
As the trading vehicle, I chose the new Micro E-mini futures, which make it possible to use 2x leverage with small trading accounts. I demonstrated how to set up Adaptrade Builder to find and code strategies that meet the stated requirements. Because the number of trades over the 20 year date range was small by design, the normal approach of dividing the data series into three segments (training, test, and validation) was replaced by separate evaluations on different symbols. The strategies were built on one symbol, screened on a second symbol, and validated on two others. The validation tests confirmed that the final strategy was not over-fit to the market.
Most people who develop trading strategies focus on the trading logic they come up with. While you can review the logic for yourself in the code file for the final strategy, which is available above, you might wonder why I didn't describe it. The reason is that it's the process that matters, not the strategy logic itself. As long as the proper process is followed, the strategy logic will be valid. This is the premise behind Adaptrade Builder. The "proper process" is a combination of the steps described in this article and the steps taken within the Builder program itself. It's even likely that different strategy logic would be found by repeating this process on the same price data. That's due to the non-deterministic nature of the build algorithm in Builder, which is fundamental to the power of the program. If different logic were found, it would be equally valid if it met the same requirements and passed the same validation tests as the final strategy found above. This highlights the fact that valid trading strategies for specific sets of requirements are not unique.
One of the key metrics in the build process was the "PL/Buy&Hold Ratio", which is the ratio of the strategy's profit/loss per contract to the buy-and-hold profit/loss per contract. This metric was used to find strategies with twice the return of the underlying index. However, because this ratio is evaluated on a "per contract" basis, the overall net profit and, therefore, rate of return relative to that of buy-and-hold can be different than the stated ratio. In some cases, for example, greater overall net profit was found with lower PL/Buy&Hold Ratio values. This is because variable position sizing was used to build the strategies, and position sizing can affect the PL/Buy&Hold Ratio. This wouldn't be an issue if a fixed number of contracts were used for each trade, but variable position sizing was used to achieve the goal of 2x leverage. For this problem, a better metric would have been the ratio of the strategy's overall return to the return of the underlying instrument.
Another effect of the variable position sizing was that an ideal equity curve is not linear when so-called antimartingale position sizing is used. Antimartingale position sizing simply means the position size increases with increasing equity. In that case, an ideal equity curve is exponential, rather than linear. This makes it more difficult to evaluate an equity curve visually when it's displayed on a linear plot. In particular, the returns at the beginning of the curve tend to be compressed on a linear plot, which makes it difficult to compare them to later returns. For that reason, it may have been helpful to evaluate the consistency of the annual returns quantitatively, such as through a metric related to something like the standard deviation of annual returns.
For those who are looking for a trading approach that's closer to buy-and-hold investing than it is to day trading, the approach described in this article might be worth considering. Using the Micro E-minis, this article demonstrated that it's possible to develop a strategy that represents a compromise between the simplicity of buy-and-hold index investing and the higher returns of active trading. Hopefully, this article can serve as a starting point for you to develop your own leveraged index trading strategy.
Good luck with your trading.
Mike Bryant
Adaptrade Software
This article appeared in the July 2019 issue of the Adaptrade Software newsletter.
HYPOTHETICAL OR SIMULATED PERFORMANCE RESULTS HAVE CERTAIN INHERENT LIMITATIONS. UNLIKE AN ACTUAL PERFORMANCE RECORD, SIMULATED RESULTS DO NOT REPRESENT ACTUAL TRADING. ALSO, SINCE THE TRADES HAVE NOT ACTUALLY BEEN EXECUTED, THE RESULTS MAY HAVE UNDER- OR OVER-COMPENSATED FOR THE IMPACT, IF ANY, OF CERTAIN MARKET FACTORS, SUCH AS LACK OF LIQUIDITY. SIMULATED TRADING PROGRAMS IN GENERAL ARE ALSO SUBJECT TO THE FACT THAT THEY ARE DESIGNED WITH THE BENEFIT OF HINDSIGHT. NO REPRESENTATION IS BEING MADE THAT ANY ACCOUNT WILL OR IS LIKELY TO ACHIEVE PROFITS OR LOSSES SIMILAR TO THOSE SHOWN.