Quantifying Chart-based Support/Resistance
Levels
A common distinction in trading
is between systematic and discretionary trading methods. Systematic traders use
hard and fast rules that are typically computerized in the form of one or more
trading systems. Discretionary traders, on the other hand, don't use trading
systems. While they have trading rules and methods, they haven't codified those
rules into a computerized trading system. I've always found this distinction to
be somewhat arbitrary. One of the tenets of good trading is to have well defined
methods. Whether you computerize those methods into a trading system or choose
to manually implement certain aspects of your approach, you still
have something that could reasonably be called a "system." In
fact, I'd go as far as to say that most discretionary methods are just trading
systems yet to be programmed. A trader may be "discretionary" only because his
approach seems too complicated to program.
One aspect of trading that can
frustrate attempts at programming is chart patterns. Reading chart patterns, such
as triangles and head and shoulder patterns, is said to be more art than
science. If you have a trading approach based on chart patterns, you're probably
a discretionary trader, if only because it's complicated to program a system to
recognize a chart pattern.
Several months ago I was
studying support and resistance levels for day trading the E-mini S&P.
After scanning numerous intraday charts to locate these price levels visually,
an algorithm occurred to me for identifying these support and resistance prices.
This month, I'll show how this algorithm works and how to program it in
TradeStation's EasyLanguage.

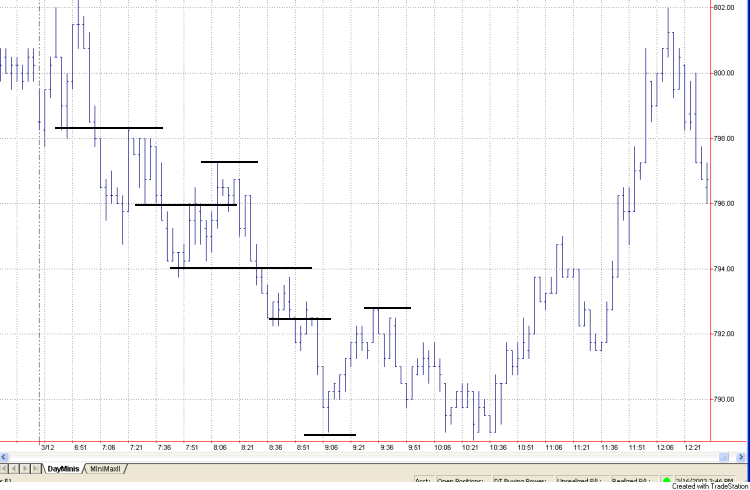
Fig. 1 A 3 minute chart
of the March E-mini S&P 500 showing several support and resistance
levels.
Consider Fig. 1. I've drawn
several horizontal lines by hand to suggest the kind of short-term support and
resistance levels I have in mind. You might look for these price levels if
you're trying to capture a few points of profit per trade. For example, you
might try to sell short at the resistance level during a downtrend and cover at
the support level. Similarly, in a up trend, you might try to buy at the support
level and sell at the resistance level.
The logic I came up with to
systematize the identification of these levels is pretty
straight-forward. As each price bar is completed, I look for the
most logical location for support and the most logical location for
resistance relative to the close of the most recently completed bar. Since we
are focusing on intraday data, which, in actual day trading, is evolving in real
time, these support/resistance locations may change from bar to bar.
To identify the locations of
support and resistance relative to the close, I scan all price levels
within X points of the close over the last N bars. At each price level, imagine
a horizontal line extending back from the current bar over the last N bars. Our
goal is find the price level at which the horizontal line best fits the last N
bars. I use a least-squares fitting method. At each price bar, determine whether
the high or low of the bar is closest to the line and add the square of the
difference between that price and the price level of the line to a running sum.
This calculation is repeated for each of the N bars closest to the current
bar to form the "sum of squares." Ignore price bars that are farther
away from the line than Y points in order to avoid skewing the sum by these
"outlier" prices. The whole process is repeated for each price level within
X points of the current close.
The resistance level is then the
price above the current bar's high for which the sum of squares is
smallest. The support level is the price below the current bar's low for which
the sum of squares is smallest.

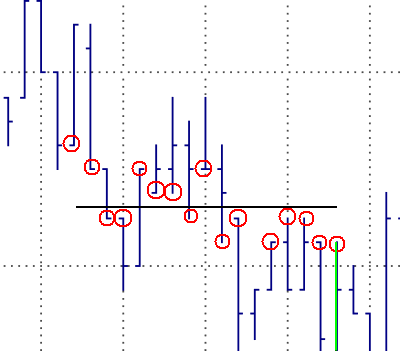
Fig. 2. Fitting a line to
the price bars.
Fig. 2. illustrates the
sum-of-squares process for a given price level. The horizontal line is a
potential resistance level for the price bar colored green. The prices used in
the sum of squares calculation are circled in red. Notice that one of
the bars does not have a red circle on either its high or low. This is
because the closest price on the bar is farther than Y points from the
horizontal line. The sum of squares for this horizontal price level is the sum
of the squares of the distances between the circled prices and the horizontal
line.
I programmed the calculation of
the support and resistance levels into an EasyLanguage function called SupRes2.
The EasyLanguage code is shown below.
{
Function: SupRes2
("Support/Resistance")
Locate the nearest price levels of support and
resistance.
Returns: Average of support and resistance levels; Also, the
support
and resistance levels are returned through the argument
list.
Michael R. Bryant
Breakout Futures
www.BreakoutFutures.com
Copyright 2003 Breakout
Futures
Feb 24, 2003
}
Input: NBars
(NumericSimple), { # bars to lookback in search
}
PriceRnge
(NumericSimple), { # points to examine above/below close
}
PFilter
(NumericSimple), { Include high/low within PFilter points
}
MinPoints
(NumericSimple), { min # points for a fit
}
SupPrice
(NumericRef), { located support price
}
ResPrice
(NumericRef); { located resistance price
}
Var:
iPrice (0), { price at current
level }
DtoLow (0), { distance from line
to low }
DtoHigh
(0), { distance from line to high
}
Sum (0), { sum
of weights }
NormSum (0), { normalized sum
}
MinSum
(999999),{ max sum of weights }
NPoints (0), { # points in sum
}
SupportP
(0), { best support price
}
ResistP
(0), { best resistance price
}
NPInc (0), { number of
price increments above/below close
}
istart
(0), { first increment to start at
}
ip (0),
{ loop counter of price increments
}
ib (0);
{ loop counter for bars }
NPInc = PriceRnge/(MinMove/PriceScale);
istart =
IntPortion(NPInc/3);
{ Search for resistance; loop over prices above close }
MinSum =
999999;
ResistP = MaxList(High, ResPrice);
For ip = istart
to NPInc Begin
iPrice = Close + ip *
(MinMove/PriceScale);
Sum =
0;
NPoints = 0;
{ Loop over bars
}
For ib = 1 to NBars Begin
{ Add up sum of
squares of distances to price line
}
DtoLow =
AbsValue(L[ib] -
iPrice);
DtoHigh =
AbsValue(H[ib] -
iPrice);
If DtoLow
<= DtoHigh and DtoLow <= PFilter then
Begin
NPoints = NPoints +
1;
Sum = Sum +
Square(DtoLow);
end
else If DtoHigh
< DtoLow and DtoHigh <= PFilter then
Begin
NPoints = NPoints +
1;
Sum = Sum +
Square(DtoHigh);
end;
end; { loop ib }
{ Record iPrice if sum is lowest so far
}
If NPoints >= MinPoints then
Begin
NormSum =
SquareRoot(Sum/NPoints);
If NormSum
< MinSum then
Begin
MinSum =
NormSum;
ResistP
=
iPrice;
end;
end;
end; { loop ip }
ResistP = MaxList(High, ResistP); { make sure resistance >= high
}
{ Search for support; loop over prices below close }
MinSum =
999999;
SupportP = MinList(Low, SupPrice);
For ip = istart
to NPInc Begin
iPrice = Close - ip *
(MinMove/PriceScale);
Sum =
0;
NPoints = 0;
{ Loop over bars
}
For ib = 1 to NBars Begin
{ Add up sum of
squares of distances to price line
}
DtoLow =
AbsValue(L[ib] -
iPrice);
DtoHigh =
AbsValue(H[ib] -
iPrice);
If DtoLow
<= DtoHigh and DtoLow <= PFilter then
Begin
NPoints = NPoints +
1;
Sum = Sum +
Square(DtoLow);
end
else If DtoHigh
< DtoLow and DtoHigh <= PFilter then
Begin
NPoints = NPoints +
1;
Sum = Sum +
Square(DtoHigh);
end;
end; { loop ib }
{ Record iPrice if sum is lowest so far
}
If NPoints >= MinPoints then
Begin
NormSum =
SquareRoot(Sum/NPoints);
If NormSum
< MinSum then
Begin
MinSum =
NormSum;
SupportP
=
iPrice;
end;
end;
end; { loop ip }
SupportP = MinList(Low, SupportP); { make sure support <= Low
}
SupPrice = SupportP;
ResPrice = ResistP;
SupRes2 = (SupportP +
ResistP)/2.;
I also created an indicator based
on the SupRes2 function to plot the support and resistance levels. The code for
the indicator is shown below.
{
Indicator: SupRes Indicator-2
Plot the
support and resistance given by the SupRes2 function.
Michael R. Bryant
Breakout Futures
www.BreakoutFutures.com
Copyright 2003 Breakout Futures
Feb 24, 2003
}
Inputs: NBars
(30), {
# bars to lookback in search
}
PriceRnge
(3),
{ # points to examine above/below close
}
PFilter
(1.0), {
points this close to line }
MinPoints
(4);
{ need at least this many points in fit }
Var: SupPrice
(C),
{ located support price }
ResPrice
(C);
{ located resistance price }
{
Call SupRes function to find nearest support/resistance }
Value1 = SupRes2(NBars, PriceRnge, PFilter, MinPoints,
SupPrice, ResPrice);
Plot1(SupPrice, "Support");
Plot2(ResPrice,
"Resistance");
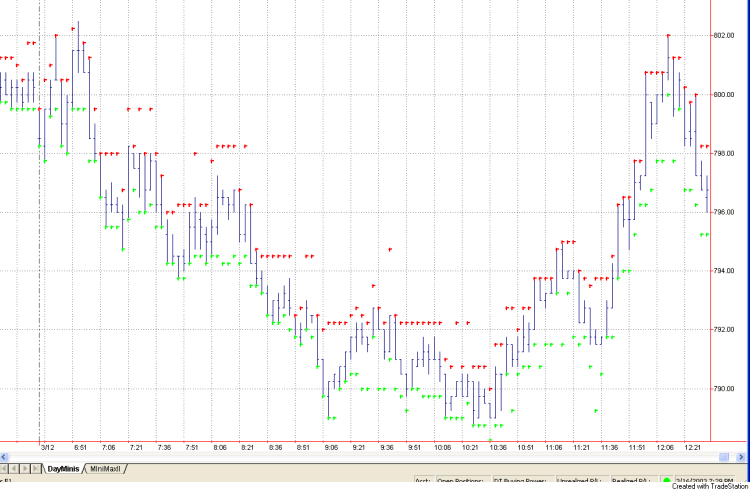
In Fig. 3, I show how the
indicator works for the same price chart shown in Fig. 1. I used the following
input parameter values: 30, 2.25, 0.75, 4. The support prices are in green
and the resistance levels in red. During downtrending markets, the support
levels tend to stay close to the price bar lows because none of the nearby price
bars have prices lower than the most recent bar's low. Similarly, in uptrending
markets, the resistance levels stay near the highs. The SupRes2 function could
be employed in a trading system in a number of different ways, such as (1) to
identify the trend based on whether support and resistance levels are rising or
falling, and (2) to trigger entries and/or exits at the identified support and
resistance levels.

Fig. 3. SupRes Indicator
plotted on a 3 minute chart of E-mini S&P data.
The SupRes2 function illustrates how
a visual task like identifying a support or resistance level on a price
chart can be systematized. I'll leave it to you to incorporate these levels
into a trading system.