Exploiting Trade Dependency
I recently discovered a pattern to
the trades for MiniMax II that can be exploited to increase the profitability of
the system. In addition to being of interest to MiniMax
traders, this presents a good opportunity to discuss trade
dependency.
It's often useful to think of
financial markets in statistical terms. For example, the trades produced by a
trading system can be represented by a statistical distribution, which shows the
frequency of occurrence of trades of different sizes. For example, you might
find that 5% of trades are between $200 and $300, 7% are between $301 and $400,
etc. Another statistical concept that is sometimes useful in
trading is trade dependency. With trading systems, dependency refers to the
relationship between consecutive trades. If a loss is more likely to follow a
win than a loss, for example, there is negative dependency. This means that wins
tend to follow losses and losses tend to follow wins. Positive dependency means
that wins tend to follow wins and losses tend to follow losses.
In most cases, there is no
statistically significant dependency among trades. In this respect, most
trading systems are analogous to flipping a coin. The odds of a
coin landing heads up is 50-50, regardless of how many times in a row you
get tails. Each coin flip is independent of every other one. Intuitively, it may
feel like the odds of getting heads is higher if you've landed 10 tails in a
row, but the coin doesn't know that you've landed 10 tails in a row. With each
flip of the coin, you still have a 50-50 chance of getting heads. Most trading
systems produce a similar lack of dependency. Whether the next trade is a win or
a loss doesn't depend on the previous trade. If your system historically has 53%
winners, the odds of the next trade being a winner are 53%, regardless of
whether you had 10 losses in a row or 10 winners in a row.
However, there are
exceptions. I created an indicator I call Trade Dependency (available for
free download).
This indicator uses a statistical test called a runs test to determine if there
is any statistically significant dependency among the last N trades produced by
a trading system. While there may be no significant dependency for a long
history of trades, there can be periods of dependency that crop up from time to
time. The Trade Dependency indicator can find these anomalies. When I recently
plotted it on MiniMax II, I found significant negative dependency on the E-mini
Nasdaq using N=30 (i.e., over the last 30 trades); see Figs. 1 and 2,
below.
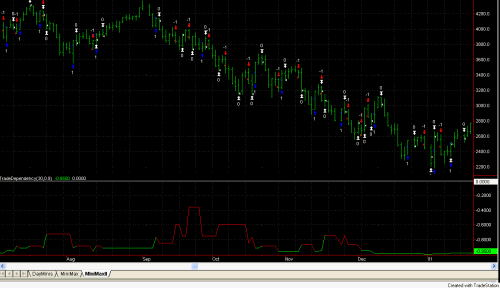
Fig. 1. The trade
dependency indicator is plotted at the bottom of the price chart for the E-mini
Nasdaq during late 2001. The white horizontal line is the zero (neutral) line
indicating no dependency. Where the line is colored red the dependency is not
significant. Where the line is colored green there is significant negative
dependency.
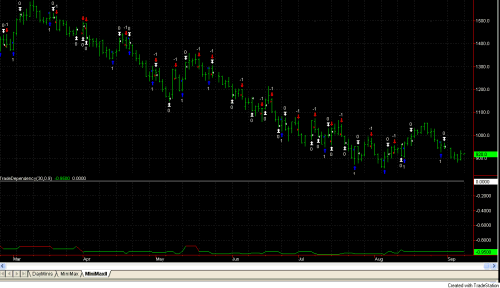
Fig. 2. Trade
dependency is plotted for the E-mini Nasdaq during recent months. Notice
that the line is mostly green, indicating persistent negative dependency that is
statistically significant.
Recall that negative dependency
means that winners tend to follows losses, and vice versa. Provided the
dependency persists long enough, it can be exploited. I tested various methods
to vary the position size based on the prior trade. The most effective method I
discovered was to decrease the fixed fraction slightly after a win and increase
it after a loss provided the Trade Dependency indicator was showing significant
negative dependency. In particular, if there is no significant dependency (red
line), I keep the fixed fraction at 4%. This means I risk 4% of my account
equity on the next trade. However, if there is significant negative dependency
(green line) and the last trade was a win, I only risk 3% on the next trade. If
there is significant negative dependency and the last trade was a loss, I risk
6% on the next trade.
Applying these rules to the
available history of MiniMax II applied to the E-mini Nasdaq (9/99 to present)
results in a final equity of $3.3M on a starting account balance of $50K with a
worst-case drawdown of 18.6%. If the fixed fraction is kept at 4% regardless of
trade dependency, the final equity is $1.3M with a worst-case drawdown of
20%. So by exploiting trade dependency, we obtain a greater return with a
smaller drawdown. I tried different size adjustments to the fixed fraction,
but these numbers (3% after a win; 6% after a loss) worked best. Notice that I'm
not suggesting you do anything as dramatic as skipping the next trade after a
win or doubling up after a loss. That kind of crude adjustment doesn't seem to
work well historically. The more subtle approach that I've outlined is
preferable. The idea is to make small adjustments to your position size based on
trade dependency and only when the dependency has been statistically significant
over the last 30 trades.
I should also
point out that there are periods of significant dependency with MiniMax II
on the E-mini S&P, but the dependency doesn't seem to last long enough
to profitably exploit.
Answers to Your
Questions
Q: I
tried using the EasyLanguage output bar in TS 6 to read the trade orders for
MiniMax, but it seems to combine the output statements for all systems that are
running. This is confusing. Is there a way to avoid this?
A:
The Output bar of TS 6 replaces the print log in older
versions of TradeStation. It's a common location where the output
from EasyLanguage "print" statements is written. Whenever the EasyLanguage
processor encounters a print statement, that output goes to the output bar. For
this reason, the order of statements in the output bar depends on the order in
which your systems are run in all the open chart windows. This, in turn, is
controlled by TradeStation, so you basically never know the order that
statements will appear in the output bar.
I really only included output statements in the
output bar because some people are probably used to using the old print log from
TS 4. I don't recommend it as the way to read orders. I recommend the Analysis
Commentary tool, which is much cleaner looking and eliminates the confusion you
refer to. That is what I'd recommend for getting your daily orders for each
system. It works the same way for each system and version, and presents the
orders in a more orderly fashion than the output bar.
Q:
In TS 6, how do I know when the continuous contract has rolled over to the
next month?
A: TradeStation
doesn't specifically alert you when a continuous contract, such @ES in TS 6,
rolls over to the next month. The easiest way to determine that this has
happened is to keep a chart with the current contract month, such as NQU02.E for
the September 2002 E-mini Nasdaq. When the continuous NQ (@NQ in TS 6) doesn't
match the September contract, you know the continuous contract has rolled over
to December. You can then open a December contract chart to
confirm.
Q:
The TradeStation Performance Summary lists something called "Max intraday
drawdown." What is this exactly, and how is it calculated? How does this differ
from the drawdown listed in the "Time" tab and from the max percentage
drawdown that you refer to with your Monte Carlo method for position
sizing?
A:
In general, the drawdown is the amount your account equity has declined from
the highest previous peak in equity. Typically, the maximum drawdown
is listed. This is the largest drawdown encountered as the equity curve is
accumulated. You would determine this by calculating the difference between the
highest high in equity minus the lowest subsequent low in equity for each equity
peak and taking the largest of these differences. This calculation can be done
on either a percentage basis or a dollar basis. To calculate the percentage
drawdown, you divide the high-low difference by the high; i.e., subtract
the lowest subsequent low in equity from the previous equity peak and divide the
difference by the equity value at the peak.