A
Volatility Filter
Traders thrive on volatility. If the
market doesn't move, we can't profit. It seems logical, then, that volatility
could be used as a filter in a trading system. But how? If high volatility is
good, should we wait for signs of high volatility before entering a trade, or
should we take a counter-trend approach and wait for low volatility in
expectation of higher volatility to follow?
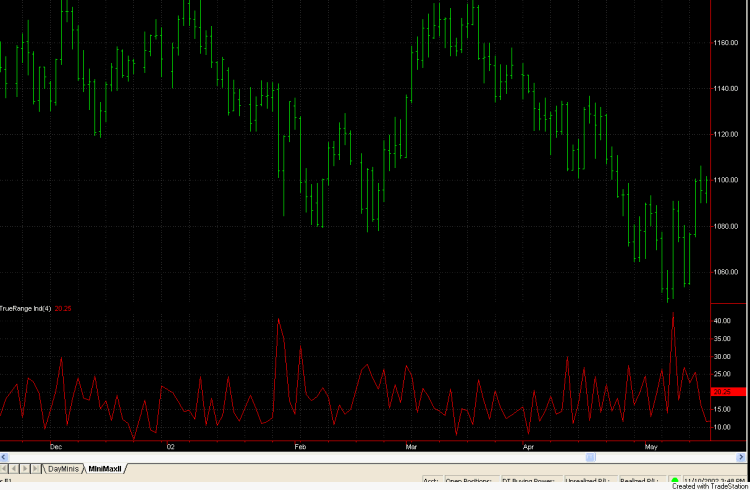
Consider the chart below,
which consists of daily bars of the E-mini S&P 500. Below the
price series I've plotted the true range. This is NOT the average true
range but simply the true range of the daily bar. To me, the striking aspect of
this plot is the cyclicality of the true range. It displays a surprising amount
of regularity, with peaks following troughs every day or two. This tells me that
if we want higher volatility, we need only wait for a low volatility day. The
following day, or perhaps the one after that, will very likely have higher
volatility, as defined by the true range.

Figure 1. Daily bars of the
E-mini S&P 500 with the true range plotted below.
One application where we might want
to use volatility is with a breakout-type system. If we want to enter the market
on a breakout, we may benefit from restricting our entries to days that have
higher volatility (e.g., higher true range). To see if this is true, I created
the following simple system, shown below in EasyLanguage:
Input:
StopPts (30); { Size of money management stop, points
}
Var: TR
(0); { True Range }
TR =
TrueRange;
Condition1 = TR < TR[1] and TR <
TR[2];
{Condition1 = true; }
Condition2 = C > C[14] and C
< C[2];
{Condition2 = C < C[2];}
Condition3 = C <
C[14] and C > C[2];
{Condition3 = C > C[2];}
If
Condition1 and Condition2 then
Buy next bar at Highest(H,
2) stop;
If
Condition1 and Condition3 then
Sell short next bar at
Lowest(L, 2) stop;
If
MarketPosition = 1 and C > EntryPrice and BarsSinceEntry >= 1
then
Sell this bar at close;
If
MarketPosition = -1 and C < EntryPrice and BarsSinceEntry >= 1
then
Buy to cover this bar at close;
If
MarketPosition = 1 then
Sell next bar at EntryPrice -
StopPts stop;
If MarketPosition = -1
then
Buy to Cover next bar at EntryPrice + StopPts
stop;
This system buys at the highest high
of the last two bars and sells at the lowest low of the last two bars following
two setup conditions. The first condition is our volatility filter. In
order to determine that we're at a low point in the true range cycle, we
require that the true range is less than it was on the previous bar and less
than it was two bars ago. The two-bar-ago condition roughly matches the cycle
length of true range, as seen from the plot in Fig. 1.
The second condition is a simple
price pattern. The system wants to buy dips in an uptrend and sell rallies in a
down trend, so for an up trend, we require the close to be greater than it was
14 bars ago. The dip is defined by C < C[2]; i.e., the close is less than it
was two bars ago. We use the reverse logic for a short trade setup. If these two
conditions are met, the system tries to enter on the next bar using the highest
high/lowest low. The system exits at the first
profitable close after at least one day and uses a fixed money management stop
defined by the input StopPts.
Now for the results. Using
TradeStation 6, I tested the system over the last 750 days on the continuous
contract E-mini S&P (symbol @ES in TS 6) with $75 per contract deducted for
trading costs. The lookback length (maximum number of bars the strategy
references) was set to 15, and the input StopPts was set to 30.
Using the volatility filter, as
in the code above, the results were as follows:
Net
Profit: $10,863
Percent
Winners: 71% (21 trades total)
Ave
Trade: $517
Max
Drawdown: -$3,013
Profit
Factor: 3.82
If we remove the volatility
filter by commenting out Condition1 and setting Condition1 = true, we get the
following results:
Net
Profit: $13,713
Percent
Winners: 69% (48 trades total)
Ave
Trade: $286
Max
Drawdown: -$6,100
Profit
Factor: 2.11
Although the net profit is
higher, it takes twice as many trades and produces twice the drawdown. The
profit factor -- a measure of robustness -- is much lower without the volatility
filter. The volatility filter screens out half the trades but less than a
quarter of the profits, indicating that it works as intended.
To confirm these results, I
also tested the volatility filter with the simpler price pattern shown by the
commented-out Condition2 and Condition3 variables above. These simpler
conditions are C < C[2] for a long entry and C > C[2] for a short entry.
Without the volatility filter, the results are marginal at
best:
Net
Profit: $3,525
Percent
Winners: 64% (120 trades total)
Ave
Trade: $29
Max
Drawdown: -$12,025
Profit
Factor: 1.07
When the volatility filter
(Condition1) is added back in, the results are considerably
better:
Net
Profit: $7,750
Percent
Winners: 67% (55 trades total)
Ave
Trade: $141
Max
Drawdown: -$5,213
Profit
Factor:
1.37
While I wouldn't recommend
trading this simple system as written, I think it demonstrates that a simple
volatility filter based on the true range can improve the performance of a
breakout system.