|
|
 |
| The Breakout
Bulletin
The following article was originally published in the November 2003 issue of
The Breakout Bulletin.
Intraday
Statistics for the E-mini S&P
Day trading the S&P 500
futures is a goal for many traders. The daily range and volume of the
S&P's -- either mini or full-size -- make them possibly the most
attractive day trading vehicles available. The e-mini's are particularly popular
because they're traded electronically and have low margin requirements and
excellent liquidity. This month I'm going to present a number of intraday
statistics for the e-mini S&P 500 futures. These statistics can reveal quite
a bit about how the market trades throughout the day and will hopefully give you
some ideas for exploiting these intraday tendencies. I'll end by illustrating
how this might be done with a simple trading system.
Many traders use
volume -- how many contracts are being bought and sold -- as a confirming
indicator. Generally speaking, high volume tends to validate a move. On the
other hand, big moves on light volume can be suspect. This raises the question:
what constitutes high and low volumes? For example, when looking at an intraday
(e.g., 5 min) chart, you might wonder if the current day's volume is above or
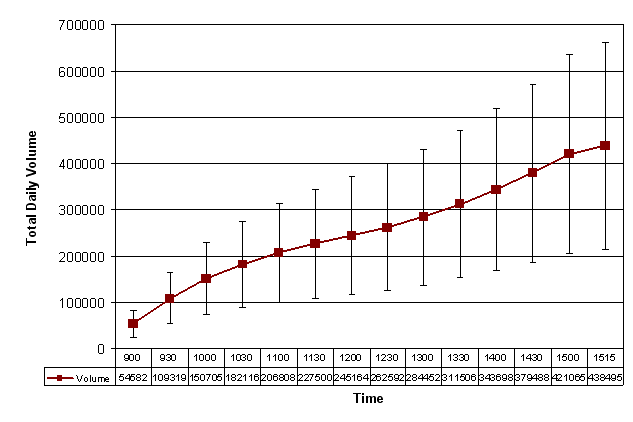
below average for that time of day. To address this, I calculated the average
daily volume at each 30 min interval over the date range 2/12/2001 to
10/22/2003. The results are shown below in Fig. 3. The horizontal axis is the
time of day, Chicago (Central) time. The vertical axis is the day's total trade
volume up through the time indicated. The error bars represent one standard
deviation. The actual volume numbers for each time point are given in the table
below the horizontal axis. For example, the average volume at 11:00 am (CT) is
about 207,000 contracts. As an example of how to use this, you might look
at the day's volume at 11:00 am and if it's much more than 207,000, you could
consider that to be a high volume day. Any move that may have occurred at that
point might be given more credence than if the volume was below average.

Figure 3. Average daily volume throughout the
trading day in the E-mini S&P.
To generate additional
statistics on the trading day, I divided the day into three equal sessions
of 2 hr, 15 min each (the entire day session is 6 hr, 45 min). On a
chart, this gives us 135 min bars. The date range was the same
as above: 2/12/01 to 10/22/03. I wrote a simple EasyLanguage system to
accumulate the following data for each bar: volume, range (high - low), and
point change (close minus prior bar's close). I wrote the data to a
comma-delimited data file, which I opened in Excel for further processing.
The advantage of 135 min bars is that it provides a morning session bar, a
mid-day bar, and an afternoon bar. The morning bar is from 8:30 am to 10:45 am
CT; the midday bar is from 10:45 to 1:00 pm CT; and the afternoon bar is from
1:00 pm to 3:15 pm CT. Below, I'll compare these different sessions and use the
results to answer questions about how the different sessions relate to one
another.
Some of the questions we can
address with these data are:
-
How differently does the
market trade in the morning than in the afternoon or
midday?
-
Does the market tend to
reverse at midday (the "midday slump")?
-
Does the market action in the
morning say anything about how the market trades in the
afternoon?
Before we try to answer these
questions, let's take a look at a few basic results. The table below lists the
daily average volume, range, and point change (absolute value) for the
morning ("AM"), midday ("Mid") and afternoon ("PM") bars. Note that the morning
bar has the largest numbers in each category, and the midday bar has the
smallest. For the point change numbers, I took the absolute value of the
difference between one close and the close of the previous bar, then averaged
those values over all days in the sample.
Table. Daily average
volume, range, and point change for the E-mini S&P 500 futures, 135 min
bars, 2/12/01 to 10/22/03.
Session Volume
Range Change (abs.)
AM 195955
12.25 7.52
Mid
88084
7.93 3.58
PM 154548 10.56
5.57
We needn't limit ourselves to
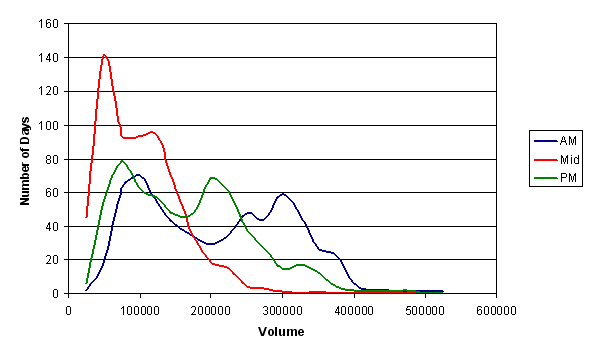
summary statistics, however. Figs. 4 - 6 show how the volumes, ranges, and point
changes are distributed for each session over the days in the sample. It's a
good idea to examine the statistical distributions in this case because the
quantities in question are not normally distributed, as can be seen from the
fact that the curves in Figs. 4 - 6 are not symmetrical, let alone
bell-shaped. The most prevalent values for volume, range, and point change
-- at the peaks of the distribution curves -- are less than the average values.
For example, in Fig. 6, the most point changes in the AM occurred in the range
from 2 to 3 points, which is well below the average AM point change of 7.52
points. Another
interesting feature of the distribution curves is that the volume distribution
curves appear to be bi-modal; that is, they have two major peaks. This means
that trading days tend to be either high volume or low volume but days with
average volume occur less frequently.

Figure 4. Trading volume distribution for
the E-mini S&P, 135 min bars, 2/12/01 to
10/22/03.
Figure 5. Range (high minus low) distribution for
the E-mini S&P, 135 min bars, 2/12/01 to
10/22/03.
Figure 6. Point change (close to close, absolute value)
distribution for the E-mini S&P, 135 min bars, 2/12/01 to
10/22/03.
When probability curves are not
normal, it's more difficult to perform significance tests. The usual method to
determine if a value is higher or lower than normal is to look at how many
standard deviations it is from the average. If it's more than, say, two standard
deviations from the average, it can be considered an unlikely occurrence. You
might use that approach to determine if the morning's volume was unusually high
or low. Knowing that the volume was unusually high, for example, might be
used to justify adding to your position later in the day if the market continues
in your favor. However, when the probability distribution is not normal, using
the standard deviation is not accurate. We could get a rough idea by simply
comparing the volume to the average volume, but a better method is to look at
the cumulative distribution of the volumes.
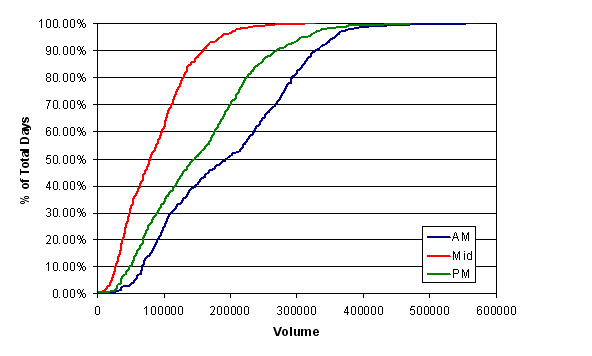
Take a look at Figs. 7 - 9, which
plot the cumulative distributions of volume, range, and point change for our 135
min bar data. The cumulative distributions tell us what percent of the time the
quantity in question is less than or equal to the value on the curve. For
example, in Fig. 7, the volume in the morning session (blue line) at the 50%
mark is about 197,000. This means that 50% of the time the volume is less than
197,000. At the 90% mark, the volume in the morning session is about 330,000.
So, about 90% of the time, we can expect that the volume at the end of the first
2 hr, 15 min of trading will be less than 330,000. If it's more than that, we
know it's an unusually high volume day. In fact, there's only a 1 in 10 chance
that the volume will be greater than that at the end of the morning session.

Figure 7. Cumulative distribution of trading
volumes for the E-mini S&P, 135 min bars, 2/12/01 to
10/22/03.
Figure 8. Cumulative distribution of point ranges
for the E-mini S&P, 135 min bars, 2/12/01 to
10/22/03.
Figure 9. Cumulative distribution of point changes
(absolute value) for the E-mini S&P, 135 min bars, 2/12/01 to
10/22/03.
As another example, consider Fig. 9.
The absolute value of the point changes in the midday session is given by the
red curve. The fact that this curve is to the left of the curves for the AM and
PM sessions indicates that the market moves less in the middle of the day.
In fact, following the 75% value on the vertical axis to the red curve in Fig.
9, we can see that 75% of the time, the change from the AM to the midday
session is less than or equal to 4.75 points. For the afternoon session (green
curve), this value is much larger. 75% of the time, the change from the
midday to the PM session is less than or equal to 7.75 points. The 75% value for
the AM session (blue curve) is 10.5 points.
Whether we look at volume, range, or
point change, the midday curve in Figs. 7 - 9 is always to the left of the PM
curve, which is to the left of the AM curve. This tells us that the morning
session is the most active -- in terms of volume, point change, or range --
followed by the afternoon session. The midday session is the least
active. Remember the three questions posed above? The observation just made
addresses question 1: the morning session is different than the afternoon or
midday in that it sees higher volume, greater range, and more point change. The
midday session sees the least. What about question 2, the midday slump? Some
traders expect a reversal of the morning trend in midday. Is this borne out by
the data? Certainly, the middle of the day sees a drop off in volume coinciding
with less volatility. However, if we look at the direction of the close of the
midday bar relative to the direction of the morning close, we find that only 47%
of the time does the midday bar close opposite to the AM close. In other
words, if the morning bar closes up relative to the close of the previous bar,
the midday bar closes down relative to the morning bar, or if the AM bar closes
down, the midday bar closes up. This happens less than 50% of the time, which
suggests that there is no midday slump in the S&P.
In question 3, I asked if the
morning session has any predictive value for the afternoon. Based on the data
collected from the 135 min bars, here are few statistics that may help answer
that question:
-
The average daily point change
(absolute value) is 10.63 points.
-
The average AM session point
change is 71% of the average daily point change (using the absolute value of
point change).
-
The direction of the point change
in the AM session is the same as the day's point change direction 75% of the
time.
-
The PM session closes in the same
direction as the AM session 55% of the time.
-
When the midday session closes in
the same direction as the AM session, the PM session also closes in that
direction 57% of the time.
There are probably at least several
different ways these results could be used in trading. I'll illustrate one
application by focusing on item #5, which suggests the following simple trading
system:
-
Buy the midday bar at its close if
the morning bar closed up and the midday bar closes higher than the morning
bar.
-
Sell the midday bar at its close
if the morning bar closed down and the midday bar closes lower than the
morning bar.
-
Exit at the day's
close.
This is basically a trend-following
system that takes advantage of the fact that when the market trades in the same
direction in both the morning and midday, it's likely to continue to trade in
that direction in the afternoon. According to result #5, this system should have
a winning percentage of 57%. Here are the results as given by the TradeStation
performance report:
Net Profit:
$16,063
Number of Trades:
287
Percent
Profitable: 57%
Ave.
Trade: $56.00
Profit Factor:
1.54
Ratio Ave.
Win/Ave. Loss: 1.02
Max. Consec.
Losers: 5
These results are without deducting
slippage and commissions, so it would probably not be tradable in practice due
to slippage on the exit. However, I haven't included a money management
stop with this system. Adding better exits, such as a money management stop
and/or a profit target, might turn this into a winning system. Also, the equity
curve for the system as written is almost a 45 degree line, which is a good
indication that there's something there to be exploited. As with any system, it
should be tested out-of-sample to make sure it's not over-fit to the data. The
fact that this system is based on a simple observation that makes intuitive
sense increases the odds that it will hold up in the future.
Hopefully, the data and results I've
presented will be food for thought for your own efforts in developing an
intraday trading system, either for the E-mini S&P or your own market
of interest. Once you collect some good, raw data, there are endless questions
that can be posed and answered with a few simple, spreadsheet manipulations.
Just make sure any system you come up with based on this type of analysis is
tested out-of-sample, either in the past or in real-time tracking before
committing real money. And don't get too carried away with complex data
manipulations and complicated patterns or you could end up trying to exploit a
statistical anomaly that isn't likely to repeat itself.
That's all for
now. Good luck with your trading.
Mike Bryant
Breakout Futures
|
|
 |