Adaptrade Builder: Screen Shots
The user interface in Builder can be switched from charting mode to strategy building mode by clicking the Strategy Builder icon in the Build menu. Charting mode is shown below. This can be used when using Builder to trade end-of-day strategies manually.
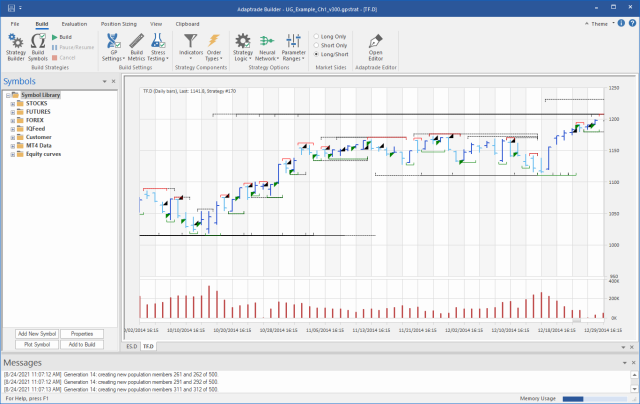
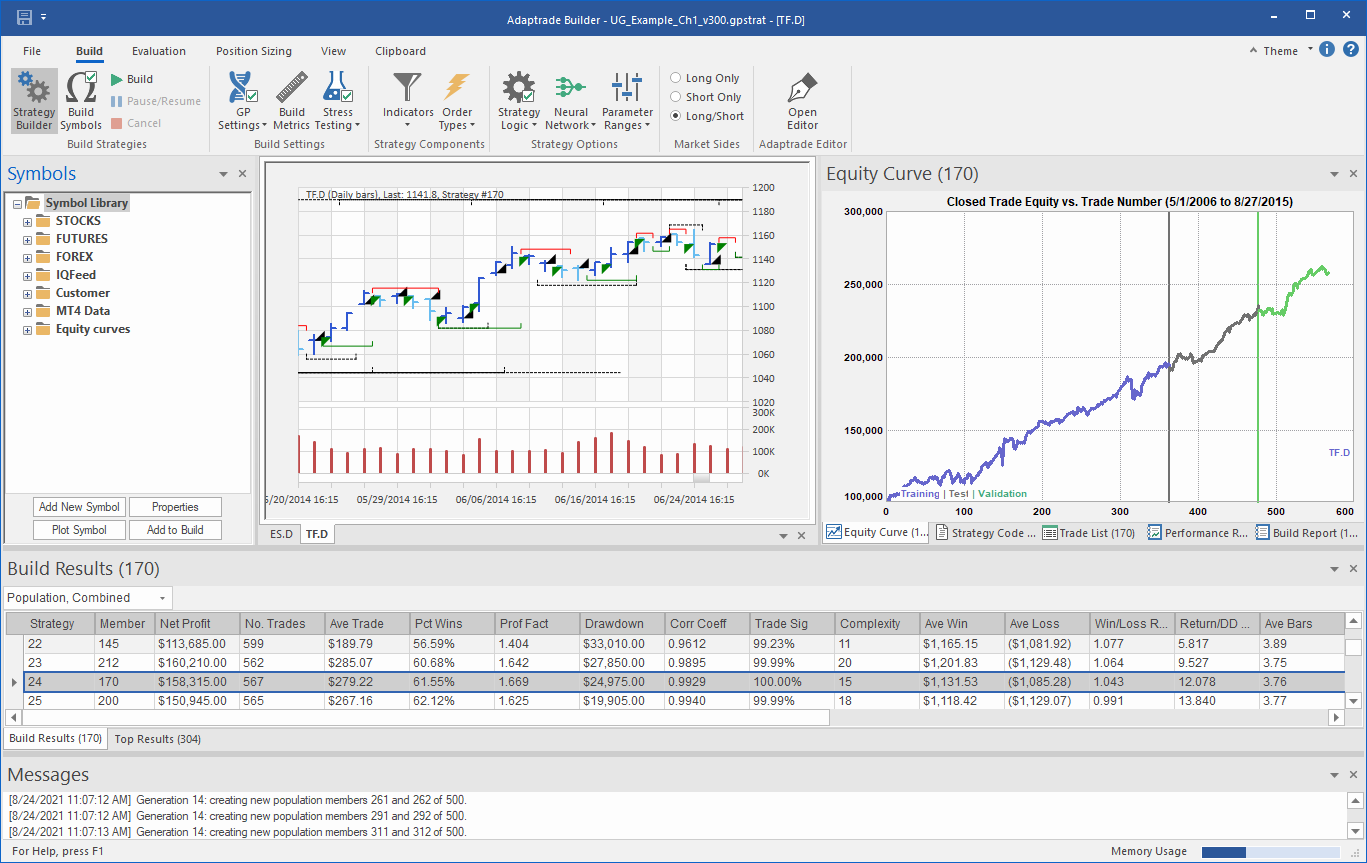
In strategy building mode, shown below, additional panes are opened to display the build results.
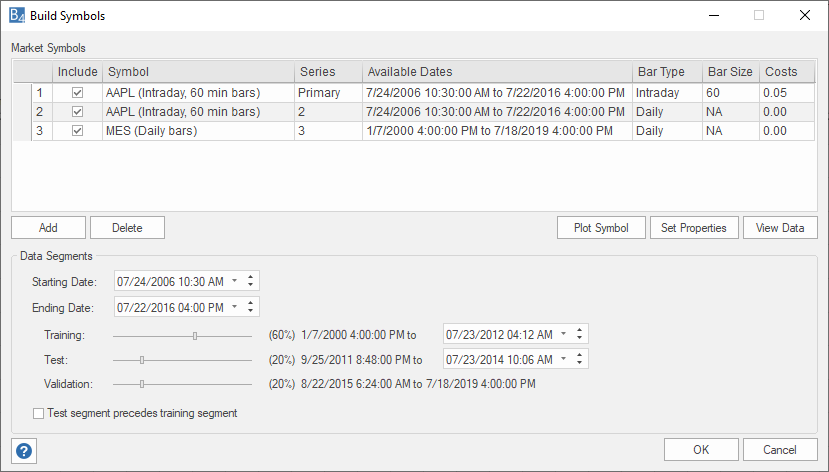
The symbols used in building strategies are selected on the Build Symbols window, below. This is also where you select the amount of available data to use for each segment: training, test, and validation. The strategies are "trained" to work well according to your specified requirements by evolving them over the training data. The test data are used to track the training process and help prevent over-fitting. The validation segment is used after building to validate the final strategies on data not used during the build process.
Settings for strategy building are arranged in the Build menu. The Evaluation menu contains settings used to re-evaluate existing strategies. The Position Sizing menu is used to select position sizing options for both building strategies and evaluating existing strategies. The View menu can be used to open the Welcome screen, which displays program tips and example projects, to set program options, to reset the pane layout, and to manually open or close the various panes and other windows in the program.


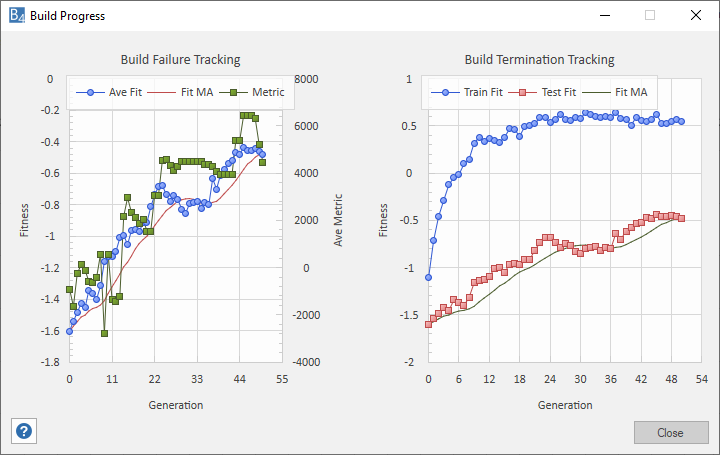
During building, the progress of the build process is shown in the Build Progress window, below. The two charts are updated after each generation of the build. The Build Failure Tracking chart shows the results in the test segment. These results correspond to the build failure rules that can be defined under GP Settings (below). The Build Termination Tracking chart shows the average fitness for the population on both the training and test segments. The results on the test segment correspond to rules that can be set up under GP Settings to stop the build based on the fitness on the test segment.
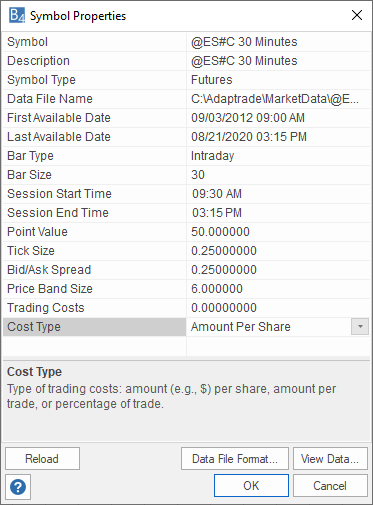
Builder uses a symbol library to store and reference price data, as shown below. You can add, remove, and format symbols using the symbol library commands. The symbol library is independent of the project file, so it can be accessed for all Builder projects. Symbols can be added to the current project or plotted in a price chart by selecting commands from the right-click (context) menu or by using the buttons below the list.
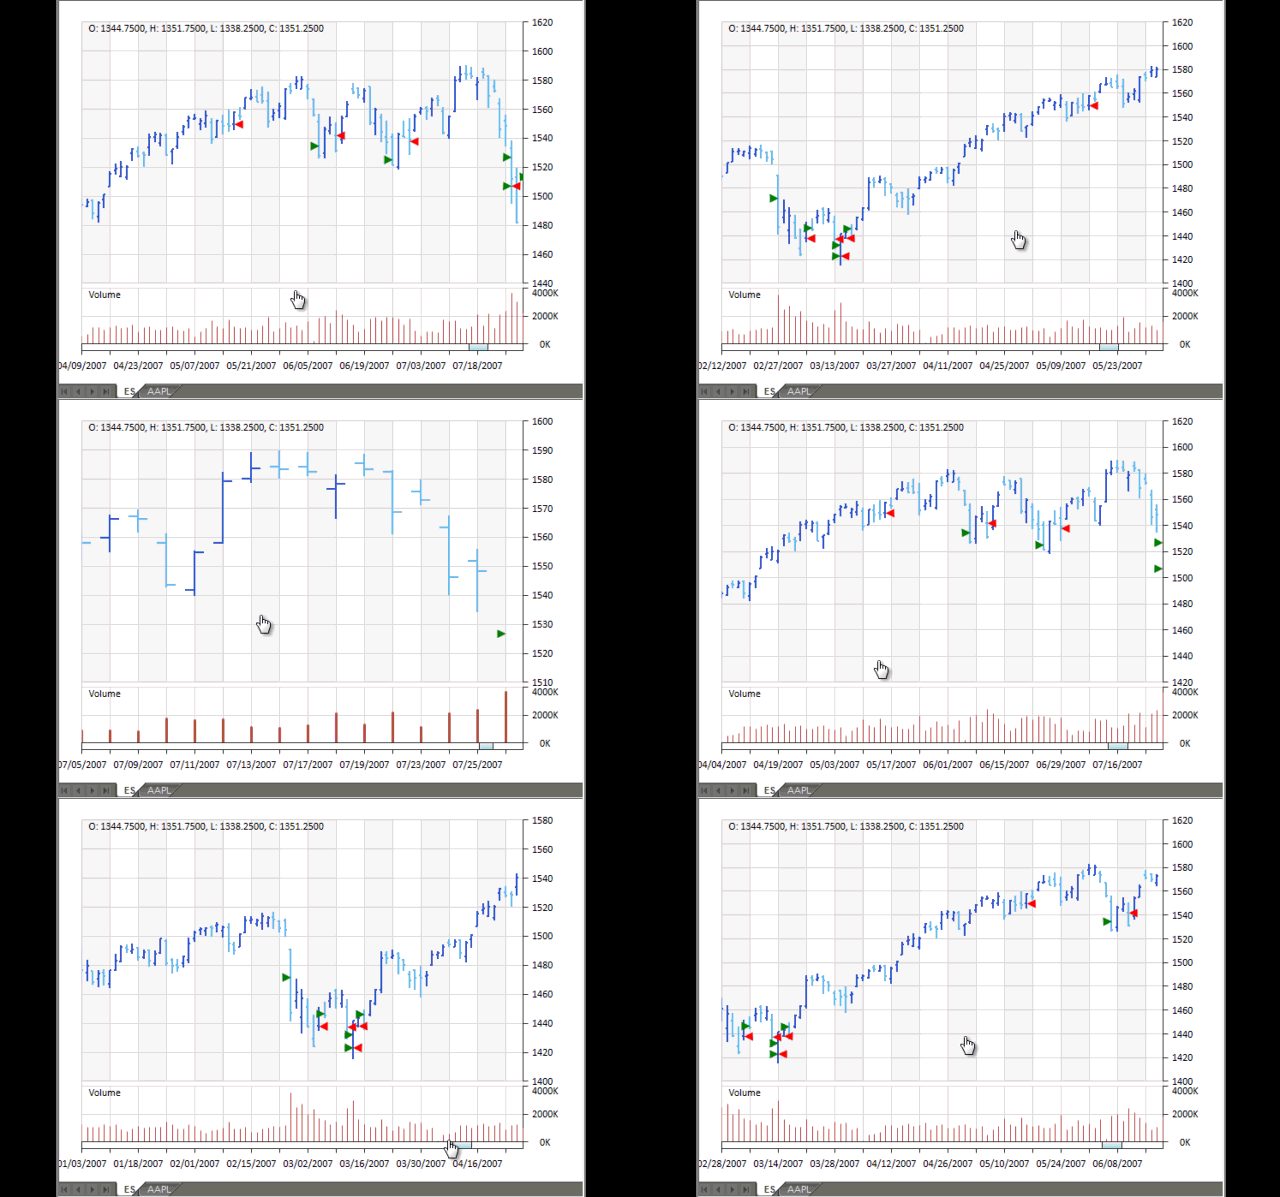
Builder also allows you to create price charts for any symbols in the program or used in the build. The animated picture below illustrates some of the charting functionality.
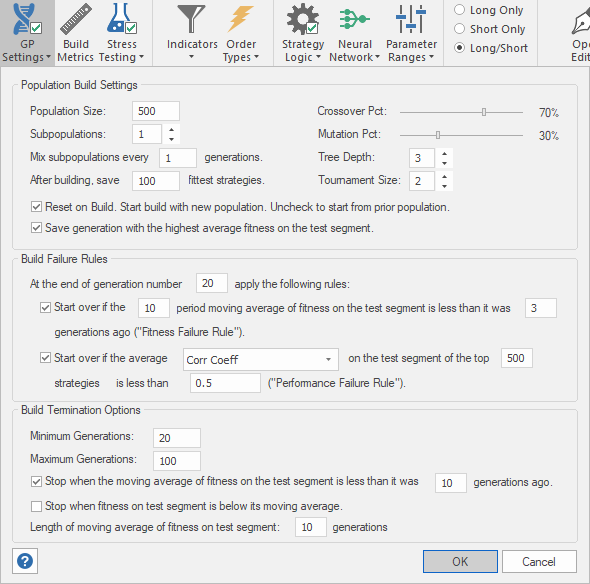
The GP Settings window is used to select rules controlling the genetic programming process used to build strategies.
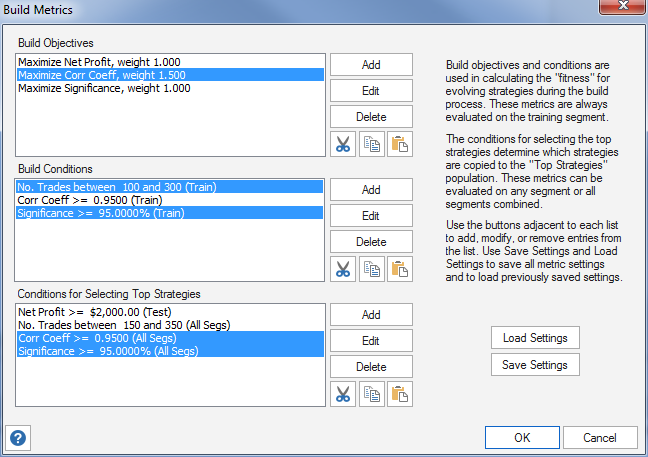
The Build Metrics window is where the build conditions and objectives that define the fitness function for building strategies are selected.
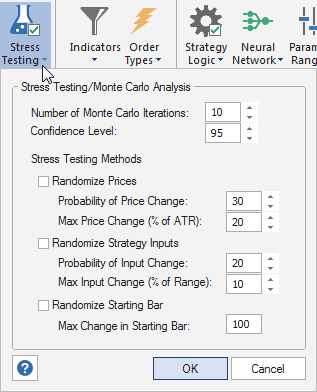
Options for stress testing, which is based on Monte Carlo analysis, are selected on the Stress Testing drop-down window.
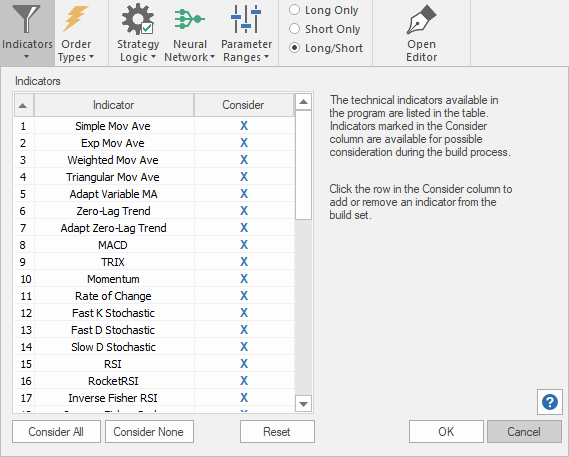
The available indicators are listed on the Indicators window, as shown below. Indicators can be removed from consideration by unchecking them in the Consider column on this window.
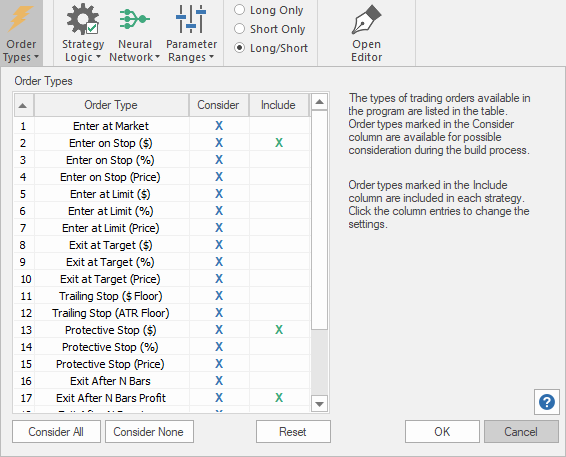
Available order types are shown in the Order Types window. Any order type that you want to include in all strategies can be checked in the Include column on this window.
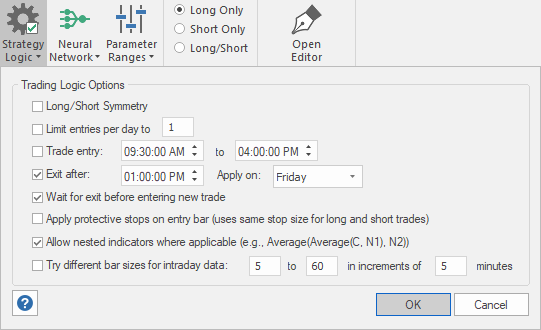
Strategy Logic options can be selected on the Strategy Logic window.
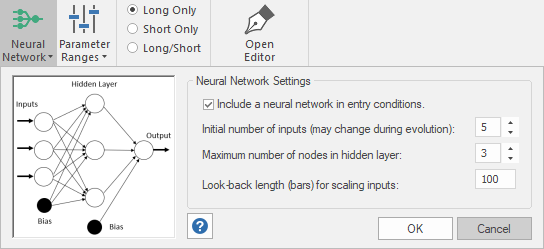
An optional neural network can be added as an additional entry filter via the Neural Network window.
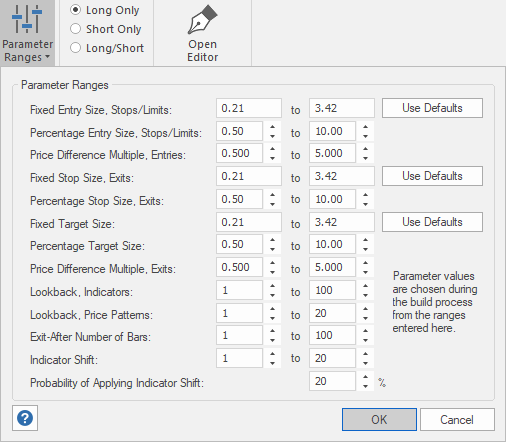
The program will select parameter values from the ranges entered on the Parameter Ranges window.
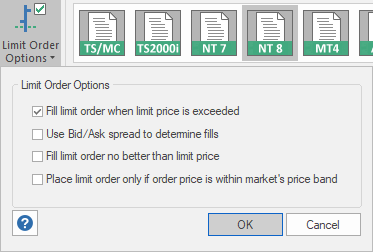
Options for how limit orders are evaluated and processed during back-testing are selected on the Limit Order Options window (Evaluation menu).
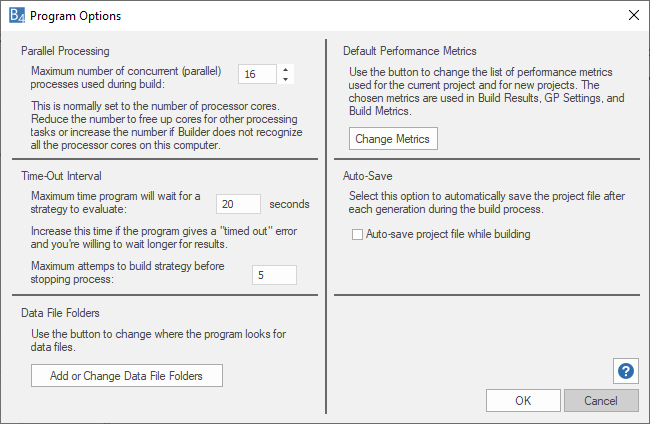
Options that affect all project files are selected on the Program Options window (View menu).
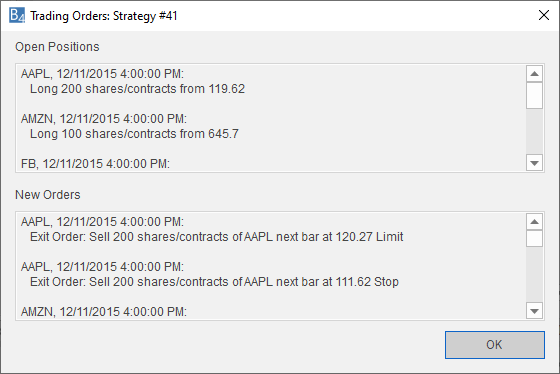
The Trading Orders window in Builder displays the current position for the selected strategy and any orders for the next bar, which enables the program to be used as an end-of-day trading platform.
