
Monte Carlo Analysis
Perform Monte Carlo analysis on your existing trading system or method to improve the accuracy of your system testing and to help prevent curve-fitting. Market System Analyzer (MSA) is a stand-alone Windows application that includes an easy-to-use Monte Carlo simulation feature. The software can be applied to any trading system or method regardless of market or time frame. When combined with the position sizing features of MSA, Monte Carlo analysis can substantially improve estimates of your system's performance metrics, such as rate of return and drawdown.
What is Monte Carlo Analysis?
Monte Carlo analysis is a computational technique for assessing the impact of random variation in a simulation model's parameters. In Monte Carlo analysis, the random variables of a model are represented by statistical distributions, which are randomly sampled to produce the model's output. When using Monte Carlo analysis to simulate trading, the trade distribution, as represented by the list of trades, is sampled to generate a trade sequence. Each such sequence is analyzed, and the results are sorted to determine the probability of each result. In this way, a probability or confidence level is assigned to each result.
Monte Carlo analysis is particularly helpful in estimating the maximum peak-to-valley drawdown. Generating a better estimate of the drawdown makes it possible to better evaluate the risk of a trading system or method. In using a Monte Carlo approach to calculate the drawdown, the historical sequence of trades is randomized, and the rate of return and drawdown are calculated for the randomized sequence. The process is then repeated several hundred or thousand times. Looking at the results in aggregate, we might find, for example, that in 95% of the sequences, the drawdown was less than 30% when 4% of the equity was risked on each trade. We would interpret this to mean that there's a 95% chance that the drawdown will be less than 30% when 4% is risked on each trade.
Monte Carlo Analysis is Easy to Apply in Market System Analyzer
In MSA, the Monte Carlo analysis is performed when the Monte Carlo Analysis command is selected from either the Analysis menu for market systems or from the Portfolio menu for portfolios.
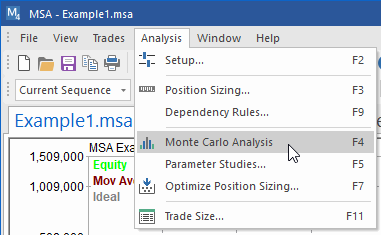
For market systems, the Analysis menu contains the Monte Carlo Analysis command.
The analysis is performed on the current sequence of trades using whatever analysis options and setting have been applied to the current sequence, including position sizing settings, dependency rules, and so on. The number of samples for the analysis can be entered on the Monte Carlo Settings tab of the Analysis Setup window. In this context, "sample" means a randomly selected sequence of trades. The default is 500 samples, which means that the Monte Carlo results will be based on 500 random trade sequences. The results will be displayed in the Monte Carlo Results window at the confidence level entered on the Monte Carlo Settings tab. An example is shown below.
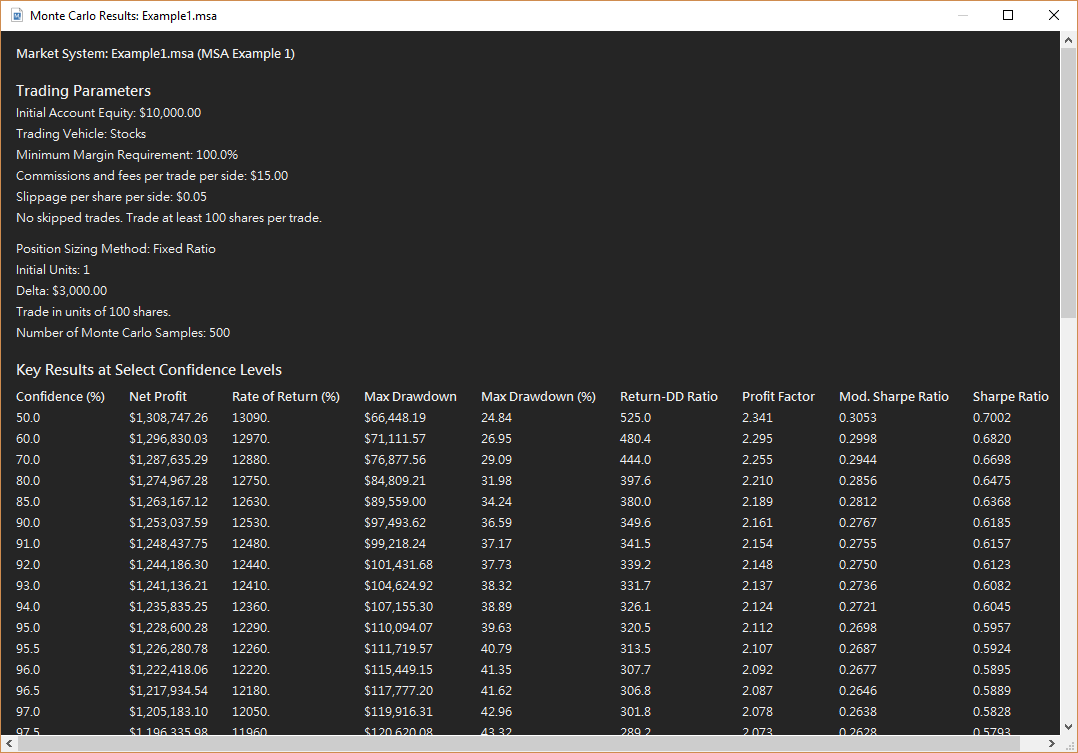
Example of Monte Carlo analysis results generated by Market System Analyzer.
In this example, the starting account equity was $10,000, and a fixed ratio position sizing method with a delta of $3000 was applied. The section labeled "Key Results at Select Confidence Levels" lists selected performance metrics at a range of confidence levels. Notice, for example, that if you demand a higher confidence level, the predicted rate of return will be lower and the worst-case drawdown will be higher. The bottom section (not shown) lists a more complete set of Monte Carlo simulation results at the user-selected confidence level of 95%. For example, the results might show a return on starting equity of 900% with 95% confidence and a profit factor of 1.60 with 95% confidence.
In addition to the performance report, the Monte Carlo results are also displayed on the equity chart. For the standard Monte Carlo analysis, in which all trades are included in the analysis, the equity chart displays confidence bands based on the user's chosen confidence level, as shown below.
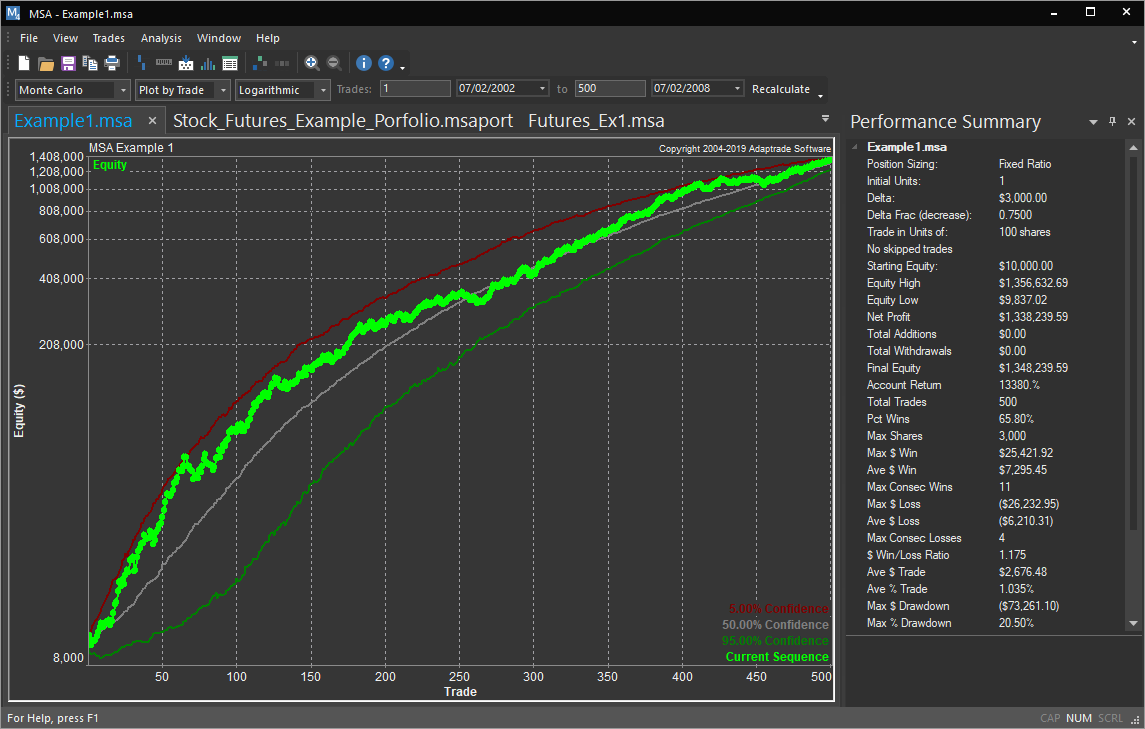
Monte Carlo analysis results showing confidence bands on the equity chart.
The other option for Monte Carlo analysis is to predict the equity curve over the last N trades, where N is entered on the Analysis Setup window (Monte Carlo Settings tab). In this type of analysis, a prediction envelope is calculated for the last N trades based on randomly sampling the prior trades. If the historical equity curve over the last N trades falls inside the envelope, the trading system or method can be considered to be performing within historical bounds. Falling below the lower band of the envelope can be used as a signal that the trading system or method may need to be re-evaluated. An example of this type of analysis is shown below.
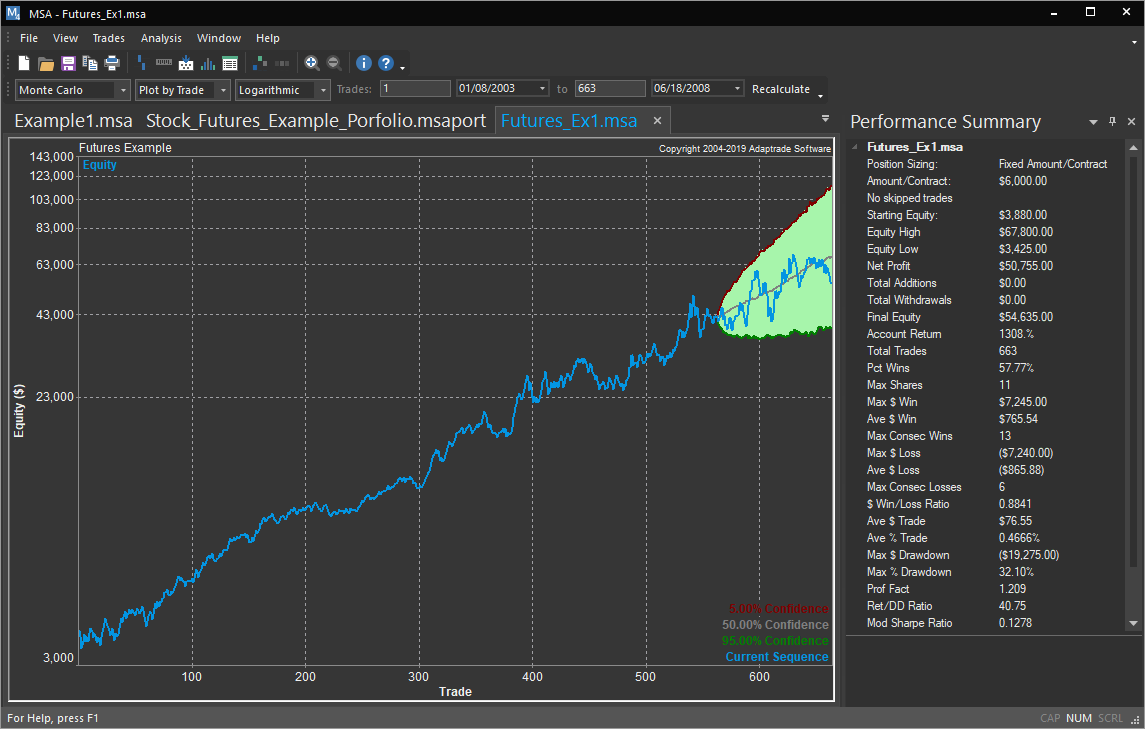
Monte Carlo analysis results showing a prediction envelope on the equity chart. The historical equity curve is within the prediction envelope, indicating that the trading system or method is performing within historical expectations.
To learn more about Market System Analyzer (MSA), click here.
To learn how to trade crossovers of the equity curve using MSA, click here.