Trend Pattern Prediction System
If a
discretionary trader expects the market to rise tomorrow, he would
probably look for opportunities to be a buyer.
Similarly, if he expects the market to drop, he'll probably try to short
the market. Oddly enough, trading systems rarely work this way.
Generally speaking, trading system don't try to predict the market. They
merely try to follow it. In fact, it's usually considered
counter-productive to have an expectation for market direction when
trading a system. Whether your personal prediction is for an up trend or
a down trend, you're usually well-advised to follow your system,
regardless of whether it goes long or short.
This doesn't mean there's no
role for market prediction in the world of trading systems. A common
technique is to predict the price change N days forward. If the
prediction is for the market to be higher in N days, you would buy today
and sell in N days. Likewise, if the prediction calls for the market to
be lower in N days, you would sell short and cover in N days. If the
prediction indicates the market will not change enough to exceed
transaction costs, you would stay out of the market. The prediction
itself can be achieved via any one of a number of methods, one of which
I'll develop below.
While this approach may be
profitable, it tends to emphasize the prediction part of the strategy
over trading system logic. Most profitable trading systems probably
succeed in large part because of the way they combine entry and exit
rules to best capture profits while minimizing losses, following the
classic dictum "let your profits run, cut your losses short". Moreover,
certain entry rules tend to favor specific market conditions, where
particular exit rules tend to work best. Simply buying today and selling
N days from now because the prediction calls for a higher market in N
days neglects to take into account the basic tenets of trading system
design.
An alternative approach, which
I'll develop here, is to predict a specific tradable pattern and, when
found, apply a set of trading rules specifically tailored to that
pattern. In this way, the prediction logic is combined with trading
system logic, giving us the best of both. I'll illustrate the approach
using a trend pattern, but other patterns, such as reversal patterns,
could be used as well.
A Basic Trend Pattern
Rather than predicting market
direction or the price change N days in the future, we'll predict the
absence or presence of a trend pattern the next day on intraday data.
There are several requirements for such a pattern:
-
It must be quantifiable.
-
The identified instances of
the pattern should be easily recognized as such.
-
The definition should be
sufficiently non-specific to generate an adequate number of
instances for trading but specific enough to permit trading rules
tailored to the pattern.
For a trend pattern, I came up
with the following rules for an up trend (the logical inverse is used
for a down trend):
-
The open-to-close price
change has to exceed some trend threshold amount.
-
The day's open minus the
low and the day's high minus the close both must be less than the
trend threshold amount.
-
The price changes (absolute
values) in the first and last thirds of the day must be less the
price change from the open to the close.
The first rule simply requires
that the change has to be high enough to be a meaningful trend. Rule #2
is designed to identify more-or-less steady trends, excluding patterns
such as dramatic up moves early in the day followed by a steady drop to
the close. Rules #3 divides the trading day into thirds and requires
that the trend is not all contained in either the opening or closing
thirds. This is intended to exclude large intraday price swings. The
trend threshold amount was defined as 60% of the average daily
close-to-open price change (absolute value) over the past 30 days.
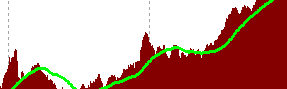
Examples of identified patterns
are shown in Fig. 1. Three days (marked with white trend lines) out of
the seven days shown have been identified as trend days according to the
rules above. I coded these rules into an EasyLangauge function for TradeStation
called GetTrendPattern, which returns +1 for an up trend, -1 for a down
trend, and 0 otherwise. This function, as well as all other code for
this month's article, is available on my
download page.
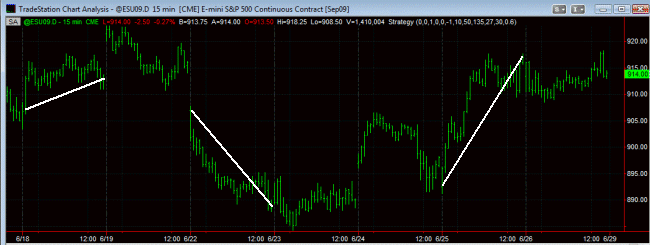
Figure 1. Identified trend
patterns on 15 min bars of the E-mini S&P 500.
Days that match the trend pattern are marked with a white trend line
from open to close.
Predicting the Pattern
Now that we've defined the
trend pattern, we need a way to predict it. There are a number of
commonly used mathematical methods to make market predictions, including
two methods I've discussed in prior newsletter articles:
neural networks and
nearest neighbor analysis. However, for this article, I'll
demonstrate how to construct a rule-based predictor.
The basic idea is to start with
a set of technical indicators, such as moving averages, rate of change,
average true range, etc. For example, we might start with the following
indicators:
I1 = Close - Average(Close,
N1)
I2 = Close - Average(Close,
N2)
I3 = Close - Close[N3]
I4 = TR - Average(TR, N4)
where I1, ..., I4 are the
indicator values, Close is the closing price on the current bar, Close[i]
is the close i bars ago, TR is true range, and N1, ..., N4 are
constants.
We then weight the indicators
with either -1, +1, or 0 and express the indicators as logical
conditions:
C1 = w1 * (Close -
Average(Close, N1)) < 0
C2 = w2 * (Close -
Average(Close, N2)) < 0
C3 = w3 * (Close -
Close[N3]) < 0
C4 = w4 * (TR - Average(TR,
N4)) < 0
where C1, ..., C4 are logical
(true/false) conditions, and w1,..., w4 are the weights. If a weight of
zero is chosen, the condition is excluded by setting it to "true".
Otherwise, the conditions are logically combined:
CC = C1 and C2 and C3 and
C4
We then evaluate this
combination of conditions (CC) on the day prior to the day being
predicted. If it's true and the trend pattern exits on the next day, or
CC is false and pattern is not present, the combination of indicators
predicts the pattern. For the indicators shown above, changing the
weight from +1 to -1 inverts the logic, which enables us to evaluate
short patterns by taking the negative of each indicator. Alternatively,
we could use different indicators for predicting long and short trend
patterns and form a different combination condition for each case.
The weights determine the
combination of indicators. For example, if w1 = 0, w2 = +1, w3 = 0 and
w4 = -1, we would have the following combination condition:
CC = (Close - Average(Close,
N2)) < 0 and (TR - Average(TR, N4)) > 0
We iterate through every
possible combination of weights and keep track of how many correct
predictions are made by each combination. For N indicators, there are
3^N combinations; e.g., 3^4 = 81 combinations in the example above. The
combination with the best prediction accuracy gives us our rule-based
predictor.
False Negatives and False
Positives
As noted above, a correct
prediction occurs when CC is true on the day/bar prior to the day on
which the trend pattern is found or when CC is false and the pattern
does not exist. This leaves two different false prediction cases. One is
when CC is false when the pattern exits. This is a false negative. The
predictor missed the pattern when it was present. The other incorrect
prediction is when CC is true when the pattern is not present. This is a
false positive. False negatives are missed opportunities, as no trade
will be triggered. A high false negative rate means the predictor is
missing a large percentage of profitable trading opportunities, but a
false negative will not result in a loss.
A false positive means the
trend pattern is predicted when it's not present, which may or may not
result in a loss, depending on the trading rules and market conditions.
As will be shown below, approximately one third of the days will consist
of the trend pattern. This means that a high overall prediction accuracy
can be achieved with a very large number of false negatives and a small
number of false positives. For example, with a total of 2100 days, 700
of which are trend patterns, you could have 100% false negatives (no
correctly identified patterns), a false positive rate of 5% (0.05 x 1400
or 70 false positives), and an accuracy of 63% (1400-70 or 1330
correctly identified negative results -- no pattern -- for an overall
accuracy of 1330/2100 = 63%).
This suggests it's important to
look not only at overall prediction accuracy but at the false positive
and false negative rates as well.
Putting it All Together
To implement the process of
finding the set of weights that provides the best prediction accuracy, I
wrote the TradeStation strategy FindPrediction. This strategy,
contained in the TrendPredict.eld and TrendPredict.txt files on the
download page,
contains the weights of the combination condition as inputs. The idea is
to use the built-in optimization capability of TradeStation to iterate
over the different weight values (-1, 0, +1). After each iteration, the
FindPrediction strategy writes out the prediction accuracy, false
negative rate, false positive rate, and weight values to the print log.
After the optimization is complete, the contents of the print log can be
copied to a text file using, for example, NotePad. After opening the
text file in a spreadsheet, the columns can be sorted by prediction
accuracy (listed as "score" in the print log) to find the weights that
give the best prediction accuracy. As noted above, it's usually
necessary to consider the false negative and false positive rates when
choosing the best set of weights.
Once the weights have been
chosen, the strategy TrendPredict can be used to trade them.
TrendPredict, also contained in the TrendPredict.eld and .txt files,
implements the trading logic for the trend pattern using the combination
condition tested in FindPrediction. The optimal weight values found via
FindPrediction are entered into TrendPredict as inputs. TrendPredict
then uses the rule-based prediction to decide when to enter long and
short. The trading logic is simple: if the combination condition
predicts a long trend pattern, enter long on the next bar and exit on
the close. A stop is placed at the trend threshold amount from the day's
open.
Remember that part of the
definition of a trend pattern is that the distance from the open to the
low (for an up trend) must be less than the trend threshold amount, so
if the market drops more than the trend threshold amount below the open,
the pattern is not an up trend, and the long trade should be exited.
This is part of how the trading logic is tied directly to the pattern.
Even though the rest of the trading logic is very simple, it also
matches the pattern. Specifically, the trend pattern is defined as a
steady up or down trend from the open to the close. All we should need
to profit from this pattern is a simple buy-and-hold-till-the close (or
sell short-and-hold-till-the-close) trade.
An E-mini S&P 500 Example
To illustrate these ideas, the
FindPrediction and TrendPredict strategies were applied to 15 min bars
of the E-mini S&P 500 market over the past 9.5 years. The rule-based
predictor uses six indicators, which means there were 3^6 or 729
different possible combinations of the six indicator conditions. The
weights in FindPrediction were set in TradeStation to optimize from -1
to +1 by 1.
A partial listing of the Print
log output from FindPrediction is shown below. The order of the listed
data items is indicated by the names in parentheses. c1 to c6 are the
six weights, Score is the overall prediction accuracy, FNeg is the false
negative rate, FPos is the false positive rate, DayCount is the number
of days of data, and PatCount is the number of trend patterns (both up
trend and down trend) in the data.
FindPrediction (c1 c2 c3 c4 c5
c6 Score FNeg FPos DayCount PatCount):,-1,-1,-1,-1,-1,-1,54.04,90.8,21.9,2387,834
FindPrediction (c1 c2 c3 c4 c5 c6 Score FNeg FPos DayCount PatCount):,-1,-1,-1,-1,-1,0,53.41,90.3,23.1,2387,834
FindPrediction (c1 c2 c3 c4 c5 c6 Score FNeg FPos DayCount PatCount):,-1,-1,-1,-1,-1,1,64.47,99.6,1.1,2387,834
FindPrediction (c1 c2 c3 c4 c5 c6 Score FNeg FPos DayCount PatCount):,-1,-1,-1,-1,0,-1,53.50,90.0,23.1,2387,834
FindPrediction (c1 c2 c3 c4 c5 c6 Score FNeg FPos DayCount PatCount):,-1,-1,-1,-1,0,0,52.33,89.0,25.5,2387,834
FindPrediction (c1 c2 c3 c4 c5 c6 Score FNeg FPos DayCount PatCount):,-1,-1,-1,-1,0,1,63.97,99.0,2.2,2387,834
FindPrediction (c1 c2 c3 c4 c5 c6 Score FNeg FPos DayCount PatCount):,-1,-1,-1,-1,1,-1,64.56,99.3,1.2,2387,834
FindPrediction (c1 c2 c3 c4 c5 c6 Score FNeg FPos DayCount PatCount):,-1,-1,-1,-1,1,0,64.01,98.7,2.3,2387,834
FindPrediction (c1 c2 c3 c4 c5 c6 Score FNeg FPos DayCount PatCount):,-1,-1,-1,-1,1,1,64.56,99.4,1.1,2387,834
FindPrediction (c1 c2 c3 c4 c5 c6 Score FNeg FPos DayCount PatCount):,-1,-1,-1,0,-1,-1,40.80,76.6,49.8,2387,834
FindPrediction (c1 c2 c3 c4 c5 c6 Score FNeg FPos DayCount PatCount):,-1,-1,-1,0,-1,0,39.13,75.1,53.3,2387,834
FindPrediction (c1 c2 c3 c4 c5 c6 Score FNeg FPos DayCount PatCount):,-1,-1,-1,0,-1,1,63.51,98.6,3.2,2387,834
FindPrediction (c1 c2 c3 c4 c5 c6 Score FNeg FPos DayCount PatCount):,-1,-1,-1,0,0,-1,39.21,75.4,52.9,2387,834
FindPrediction (c1 c2 c3 c4 c5 c6 Score FNeg FPos DayCount PatCount):,-1,-1,-1,0,0,0,36.15,72.3,59.3,2387,834
FindPrediction (c1 c2 c3 c4 c5 c6 Score FNeg FPos DayCount PatCount):,-1,-1,-1,0,0,1,62.38,97.0,5.7,2387,834
FindPrediction (c1 c2 c3 c4 c5 c6 Score FNeg FPos DayCount PatCount):,-1,-1,-1,0,1,-1,63.64,98.9,2.8,2387,834
FindPrediction (c1 c2 c3 c4 c5 c6 Score FNeg FPos DayCount PatCount):,-1,-1,-1,0,1,0,62.34,97.4,5.6,2387,834
FindPrediction (c1 c2 c3 c4 c5 c6 Score FNeg FPos DayCount PatCount):,-1,-1,-1,0,1,1,63.93,98.4,2.6,2387,834
FindPrediction (c1 c2 c3 c4 c5 c6 Score FNeg FPos DayCount PatCount):,-1,-1,-1,1,-1,-1,51.82,85.9,27.9,2387,834
FindPrediction (c1 c2 c3 c4 c5 c6 Score FNeg FPos DayCount PatCount):,-1,-1,-1,1,-1,0,50.78,84.8,30.1,2387,834
FindPrediction (c1 c2 c3 c4 c5 c6 Score FNeg FPos DayCount PatCount):,-1,-1,-1,1,-1,1,64.10,98.9,2.1,2387,834
FindPrediction (c1 c2 c3 c4 c5 c6 Score FNeg FPos DayCount PatCount):,-1,-1,-1,1,0,-1,50.78,85.4,29.8,2387,834
FindPrediction (c1 c2 c3 c4 c5 c6 Score FNeg FPos DayCount PatCount):,-1,-1,-1,1,0,0,48.97,83.3,33.7,2387,834
FindPrediction (c1 c2 c3 c4 c5 c6 Score FNeg FPos DayCount PatCount):,-1,-1,-1,1,0,1,63.47,98.0,3.5,2387,834
FindPrediction (c1 c2 c3 c4 c5 c6 Score FNeg FPos DayCount PatCount):,-1,-1,-1,1,1,-1,64.14,99.6,1.6,2387,834
FindPrediction (c1 c2 c3 c4 c5 c6 Score FNeg FPos DayCount PatCount):,-1,-1,-1,1,1,0,63.39,98.7,3.3,2387,834
FindPrediction (c1 c2 c3 c4 c5 c6 Score FNeg FPos DayCount PatCount):,-1,-1,-1,1,1,1,64.43,99.0,1.5,2387,834
FindPrediction (c1 c2 c3 c4 c5 c6 Score FNeg FPos DayCount PatCount):,-1,-1,0,-1,-1,-1,51.49,88.2,27.2,2387,834
FindPrediction (c1 c2 c3 c4 c5 c6 Score FNeg FPos DayCount PatCount):,-1,-1,0,-1,-1,0,50.52,87.4,29.1,2387,834
FindPrediction (c1 c2 c3 c4 c5 c6 Score FNeg FPos DayCount PatCount):,-1,-1,0,-1,-1,1,64.14,99.3,1.8,2387,834
FindPrediction (c1 c2 c3 c4 c5 c6 Score FNeg FPos DayCount PatCount):,-1,-1,0,-1,0,-1,50.78,87.1,28.9,2387,834
After copying the complete set
of data to a spreadsheet and sorting, I found several possible candidate
sets of weights to test. As noted above, the highest overall accuracy
(Score) is not always the best solution because it may have a small
number of trades. The following combination had a good balance of trade
number and overall accuracy:
FindPrediction (c1 c2 c3 c4 c5
c6 Score FNeg FPos DayCount PatCount):,0,0,0,0,1,-1,59.95,90.5,12.9,2387,834
This solution has an overall
prediction accuracy of 59.95% with a false negative rate of 90.5% and a
false positive rate of 12.9%. Notice that the predictor is only
correctly identified 9.5% of the trend patterns that exist! Fortunately,
there are a large number of patterns (834) so there is still opportunity
for profit. At the same time, it incorrectly predicted a trend where
none exits only 12.9% of the time.
To see how well this rule-based
predictor does in conjunction with the trading rules, the optimal
weights were entered as inputs into the TrendPredict strategy. Using
round turn trading costs of $15, the following results were found:
Net Profit: $35,225 (Long:
$14,247.50; Short: $20,977.50)
Profit Factor: 1.79
Number of trades: 330
Percent Profitable: 40.9%
Average Trade: $106.74
Max Drawdown: $4962.50
The corresponding equity curve
is shown below in Fig. 2.
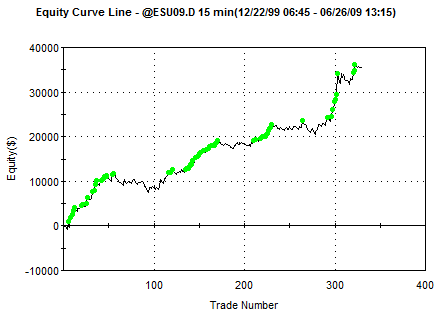
Figure 2. Equity curve for the
TrendPredict strategy on 15 min bars of the E-mini S&P 500, 12/1999 - 6/2009.
One contract per trade. $15 round turn trading costs.
Based solely on the prediction
accuracy, the percentage of winning trades of the system should be less
than 30%. The fact that it's greater than 40% implies that some of the
non-trend pattern trades (false positives) turned out to be winners. In
part, this reflects the added value of the trading logic over and above
that of the prediction rules. It also implies that the overall approach
should not be judged until the trading results are obtained. The quality
of the prediction, while important, is only half the story.
Conclusions
Because these results are based
on an optimized prediction pattern, the trading system itself is
optimized. Nonetheless, I think the results demonstrate the potential of
using rule-based pattern prediction. Only one simple pattern was
considered here. A more sophisticated system would use several different
types of trend and counter-trend (reversal) patterns. Additional
indicators could be added as well. For each pattern, you would implement
a set of trading rules specific to that pattern.
If you want to try this
approach in your own trading, be sure to test the final results either
out-of-sample (i.e., on data not used in the optimization) or in real
time until the system has been tracked over a convincing sample of
trades.